
Waters Corp (WAT, Financial) has recently been in the spotlight, drawing interest from investors and financial analysts due to its robust financial stance. With shares currently priced at $278.99, Waters Corp has witnessed a daily loss of 0.5%, marked against a three-month change of 3.4%. A thorough analysis, underlined by the GF Score, suggests that Waters Corp is well-positioned for substantial growth in the near future.
What Is the GF Score?
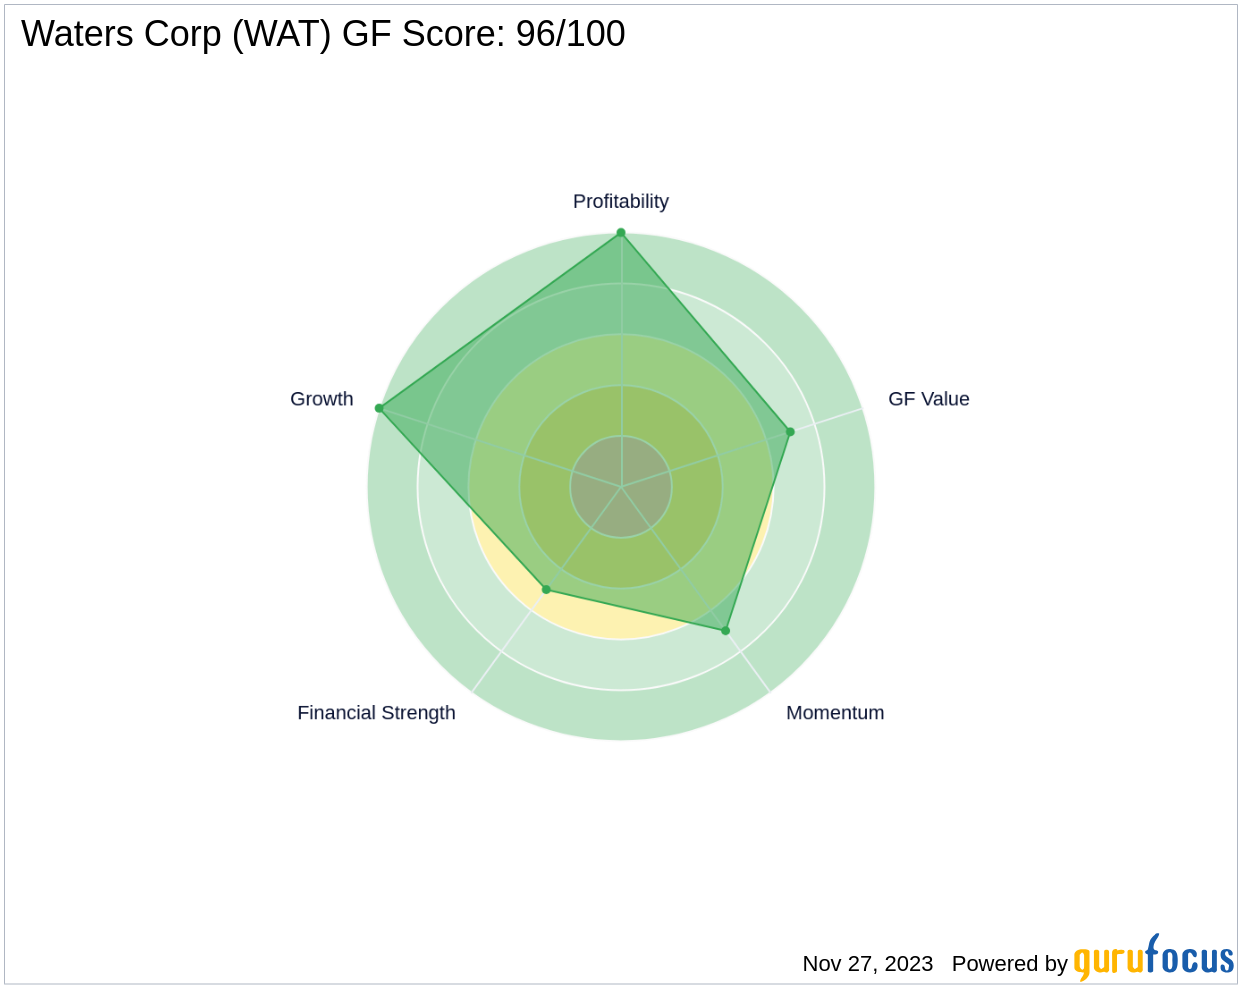
The GF Score is a stock performance ranking system developed by GuruFocus using five aspects of valuation, which has been found to be closely correlated to the long-term performances of stocks by backtesting from 2006 to 2021. The stocks with a higher GF Score generally generate higher returns than those with a lower GF Score. Therefore, when picking stocks, investors should invest in companies with high GF Scores. The GF Score ranges from 0 to 100, with 100 as the highest rank.
- Financial strength rank: 5/10
- Profitability rank: 10/10
- Growth rank: 10/10
- GF Value rank: 7/10
- Momentum rank: 7/10
Each one of these components is ranked and the ranks also have positive correlation with the long term performances of stocks. The GF score is calculated using the five key aspects of analysis. Through backtesting, we know that each of these key aspects has a different impact on the stock price performance. Thus, they are weighted differently when calculating the total score. With a high profitability and growth rank, but a moderate financial strength rank, GuruFocus assigned Waters Corp the GF Score of 96 out of 100, which signals the highest outperformance potential.
Understanding Waters Corp Business
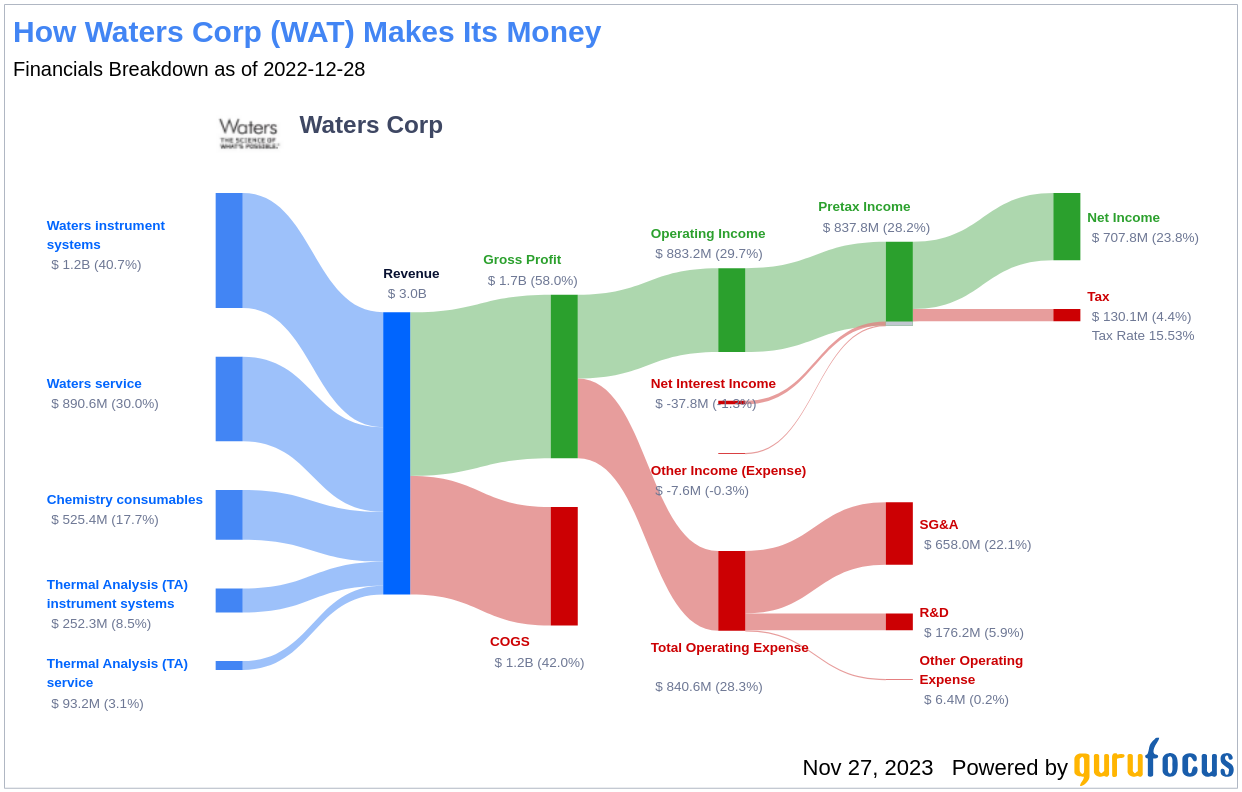
Waters Corp (WAT, Financial), with a market cap of $16.50 billion and sales of $2.99 billion, operates in the analytical instruments industry. The company specializes in liquid chromatography, mass spectrometry, and thermal analysis tools. These instruments are critical in providing detailed information about the molecular structures and physical properties of various products, aiding clients in improving the health and well-being of end users. In 2022, Waters Corp generated 59% of its sales from pharmaceutical customers, 31% from industrial clients, and 10% from academic/government institutions, showcasing a diversified and stable customer base.
Profitability Rank Breakdown
The Profitability Rank of Waters Corp is a testament to its superior ability to generate profits compared to its industry peers. This high rank is indicative of the company's efficient operations and strong pricing power, which contribute to its robust bottom line.
Waters Corp's strong Predictability Rank of 4.5 stars out of five underscores its consistent operational performance, providing investors with increased confidence in the company's financial stability and future earnings potential.
Growth Rank Breakdown
Waters Corp's high Growth Rank reflects its commitment to expanding its business and maintaining a competitive edge. The company's 3-Year Revenue Growth Rate of 11.7% outperforms 52.97% of companies in the Medical Diagnostics & Research industry. Additionally, the company's EBITDA has seen a consistent increase, with a three-year growth rate of 11.4% and a five-year rate of 11.5%, highlighting Waters Corp's ability to drive growth and improve profitability over time.
Next Steps
Considering Waters Corp's financial strength, profitability, and growth metrics, the GF Score highlights the firm's unparalleled position for potential outperformance. Investors looking for companies with similar robust financial health and growth prospects can explore more options using the GF Score Screen available to GuruFocus Premium members.
As Waters Corp continues to innovate and lead in its field, the company's strong GF Score is a beacon for value investors seeking market outperformance. Will Waters Corp maintain its trajectory and reward investors who are tuned into its financial and competitive strengths? Only time will tell, but the indicators certainly point towards a positive outlook.
This article, generated by GuruFocus, is designed to provide general insights and is not tailored financial advice. Our commentary is rooted in historical data and analyst projections, utilizing an impartial methodology, and is not intended to serve as specific investment guidance. It does not formulate a recommendation to purchase or divest any stock and does not consider individual investment objectives or financial circumstances. Our objective is to deliver long-term, fundamental data-driven analysis. Be aware that our analysis might not incorporate the most recent, price-sensitive company announcements or qualitative information. GuruFocus holds no position in the stocks mentioned herein.