

Agilent Technologies Inc (A, Financial) has remained steady with a 0% change in its stock price today, reflecting a stable market sentiment. Over the last three months, the stock has seen a modest gain of 4.76%, and with an Earnings Per Share (EPS) of $3.82, investors are keen to understand if this performance aligns with the company's intrinsic value. Is Agilent Technologies modestly undervalued as the numbers suggest? Let's delve into the valuation analysis to uncover the answer.
Company Introduction
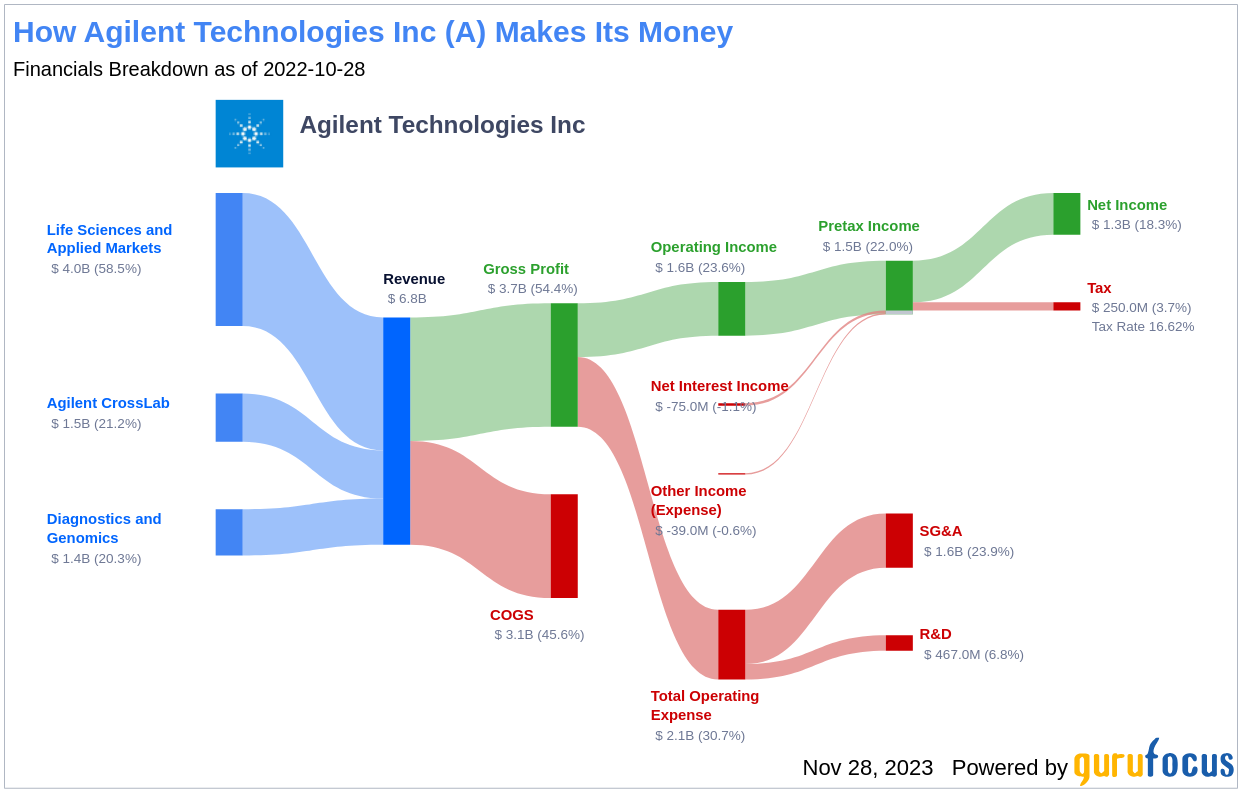
Agilent Technologies Inc (A, Financial), originally part of Hewlett-Packard, has transformed into a leader in life sciences and diagnostics since its inception in 1999. The company's diverse portfolio addresses a wide spectrum of customers, from biopharmaceutical to government organizations, through its three main segments: life science and applied tools, cross lab, and diagnostics and genomics. With a significant presence in the U.S. and China, Agilent Technologies stands out in the market with a current stock price of $125.01, against a Fair Value (GF Value) of $151.93, indicating potential undervaluation. This snapshot sets the stage for an in-depth analysis of the company's financial health and market potential.
Summarize GF Value
The GF Value is an exclusive metric that estimates the intrinsic value of a stock based on historical trading multiples, a GuruFocus adjustment factor, and future business performance forecasts. The GF Value Line provides a benchmark for the stock's fair trading value. Currently, Agilent Technologies (A, Financial) appears modestly undervalued with a market cap of $36.60 billion and a stock price of $125.01, suggesting that the stock may offer a higher long-term return than its business growth alone would indicate.

Link: These companies may deliver higher future returns at reduced risk.
Financial Strength
Investing in companies with robust financial strength is crucial to avoid permanent capital loss. Agilent Technologies' cash-to-debt ratio of 0.48 places it in a less favorable position than 66.81% of peers in the Medical Diagnostics & Research industry. Despite this, the company's financial strength is rated 7 out of 10 by GuruFocus, reflecting a solid balance sheet.
Profitability and Growth
Consistent profitability is a key indicator of a company's stability and potential as an investment. Agilent Technologies boasts a decade of profitability, with a notable operating margin of 20.2%, outperforming 87.34% of its industry competitors. With a revenue of $7 billion and an EPS of $3.82, the company's profitability is ranked 9 out of 10, underscoring its robust financial health.
Moreover, growth is a vital determinant of a company's valuation. Agilent Technologies' 3-year average annual revenue growth rate of 12% surpasses 53.47% of its industry peers, while its 3-year average EBITDA growth rate of 17.9% is also impressive, ranking above 61.62% of competitors in the industry.
ROIC vs WACC
Comparing Return on Invested Capital (ROIC) to the Weighted Average Cost of Capital (WACC) is a way to assess a company's profitability and value creation. Agilent Technologies' ROIC of 13.47% over the past 12 months suggests that the company is effectively generating cash flow relative to its capital investment, as it exceeds the WACC of 10.73%.
Conclusion
In summary, the evidence suggests that Agilent Technologies (A, Financial) is modestly undervalued. The company's financial condition is fair, profitability is strong, and growth is commendable, outperforming a significant portion of its industry peers. For a more detailed financial overview of Agilent Technologies, investors are encouraged to review the company's 30-Year Financials here.
To uncover high-quality companies that may deliver above-average returns, consider exploring the GuruFocus High Quality Low Capex Screener.
This article, generated by GuruFocus, is designed to provide general insights and is not tailored financial advice. Our commentary is rooted in historical data and analyst projections, utilizing an impartial methodology, and is not intended to serve as specific investment guidance. It does not formulate a recommendation to purchase or divest any stock and does not consider individual investment objectives or financial circumstances. Our objective is to deliver long-term, fundamental data-driven analysis. Be aware that our analysis might not incorporate the most recent, price-sensitive company announcements or qualitative information. GuruFocus holds no position in the stocks mentioned herein.