
Steel Dynamics Inc (STLD, Financial) has recently been in the spotlight, drawing interest from investors and financial analysts due to its robust financial stance. With shares currently priced at $115.57, Steel Dynamics Inc has witnessed a daily gain of 0.28%, marked against a three-month change of 13.71%. A thorough analysis, underlined by the GF Score, suggests that Steel Dynamics Inc is well-positioned for substantial growth in the near future.
What Is the GF Score?
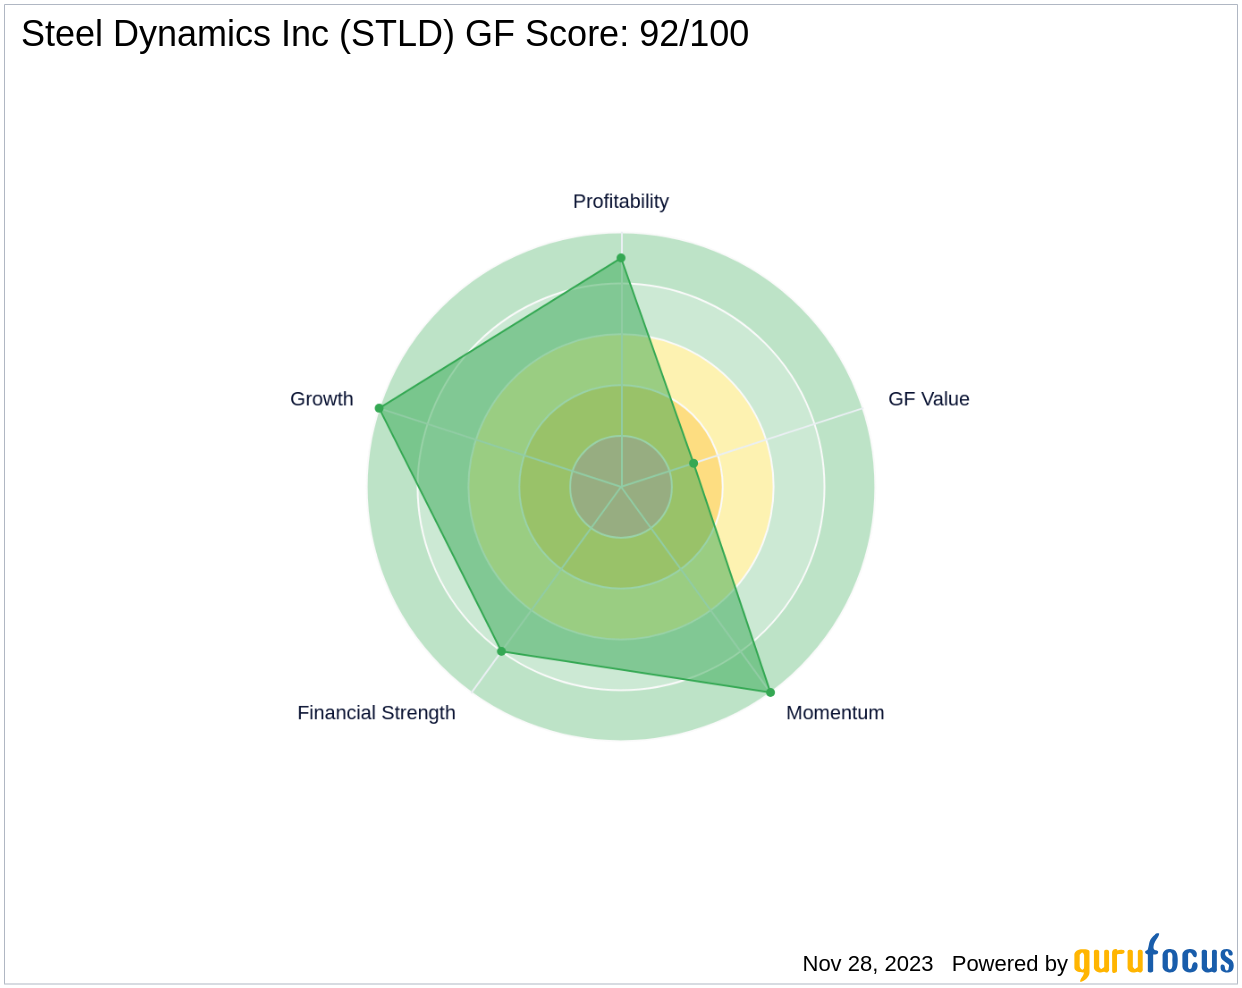
The GF Score is a stock performance ranking system developed by GuruFocus using five aspects of valuation, which has been found to be closely correlated to the long-term performances of stocks by backtesting from 2006 to 2021. The stocks with a higher GF Score generally generate higher returns than those with a lower GF Score. Therefore, when picking stocks, investors should invest in companies with high GF Scores. The GF Score ranges from 0 to 100, with 100 as the highest rank.
- Financial strength rank: 8/10
- Profitability rank: 9/10
- Growth rank: 10/10
- GF Value rank: 3/10
- Momentum rank: 10/10
Steel Dynamics Inc boasts high ranks in financial strength, profitability, and growth, with slightly lower performance in GF Value. The company's momentum is also at its peak. GuruFocus assigned Steel Dynamics Inc a GF Score of 92 out of 100, which signals the highest outperformance potential.
Understanding Steel Dynamics Inc Business
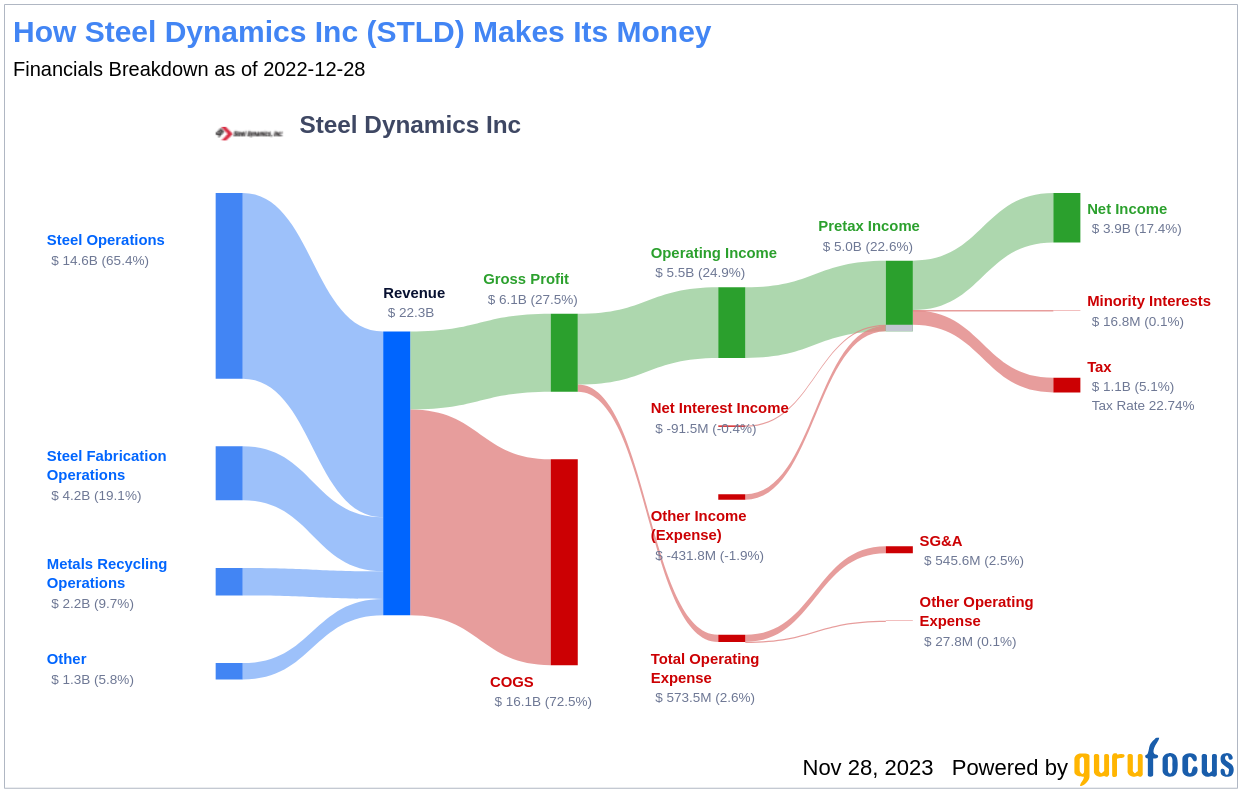
Steel Dynamics Inc operates scrap-based steel minimills with roughly 16 million tons of annual steel production capacity. The company's segments include steel operations, metals recycling operations, and steel fabrication operations. It generates maximum revenue from the steel operations segment. With a market cap of $18.70 billion and sales of $19.39 billion, Steel Dynamics Inc's operating margin stands at a healthy 19.06%, indicating its efficiency in managing expenses relative to its revenue.
Financial Strength Breakdown
Steel Dynamics Inc's robust balance sheet exhibits resilience against financial volatility, reflecting prudent management of capital structure. The company's Interest Coverage ratio is an impressive 43.2, showcasing its strong capability to cover its interest obligations. With an Altman Z-Score of 5.54, Steel Dynamics Inc is well-defended against financial distress. The Debt-to-Revenue ratio of 0.16 further solidifies its financial health, indicating strategic handling of debt.
Profitability Rank Breakdown
The Profitability Rank reflects Steel Dynamics Inc's impressive standing among its peers in generating profit. The company's Operating Margin has increased significantly over the past five years, with the latest figures showing a margin of 24.91%. Additionally, the Gross Margin has consistently risen, reaching 27.48% in the most recent year. These trends underscore the company's growing proficiency in transforming revenue into profit.
Growth Rank Breakdown
Steel Dynamics Inc's high Growth Rank demonstrates a strong commitment to expanding its business. The company's 3-Year Revenue Growth Rate is 36.5%, outperforming 91.72% of companies in the Steel industry. The EBITDA growth rates over the past three and five years are 70.6 and 36.9, respectively, highlighting the company's capability to drive growth.
Next Steps
Considering Steel Dynamics Inc's financial strength, profitability, and growth metrics, the GF Score highlights the firm's unparalleled position for potential outperformance. Investors looking for similar opportunities can explore more companies with strong GF Scores using the GF Score Screen available to GuruFocus Premium members.
This article, generated by GuruFocus, is designed to provide general insights and is not tailored financial advice. Our commentary is rooted in historical data and analyst projections, utilizing an impartial methodology, and is not intended to serve as specific investment guidance. It does not formulate a recommendation to purchase or divest any stock and does not consider individual investment objectives or financial circumstances. Our objective is to deliver long-term, fundamental data-driven analysis. Be aware that our analysis might not incorporate the most recent, price-sensitive company announcements or qualitative information. GuruFocus holds no position in the stocks mentioned herein.