

As investors scrutinize the daily stock market fluctuations, PayPal Holdings Inc (PYPL, Financial) presents a compelling case with a recent daily gain of 3.69% and a 3-month loss of -5.15%. With an Earnings Per Share (EPS) of 3.35, the question arises: is PayPal Holdings significantly undervalued? This analysis delves into the valuation of PYPL, inviting readers to explore the financial intricacies that could suggest a potential undervaluation of the stock.
Understanding PayPal Holdings Inc (PYPL, Financial)
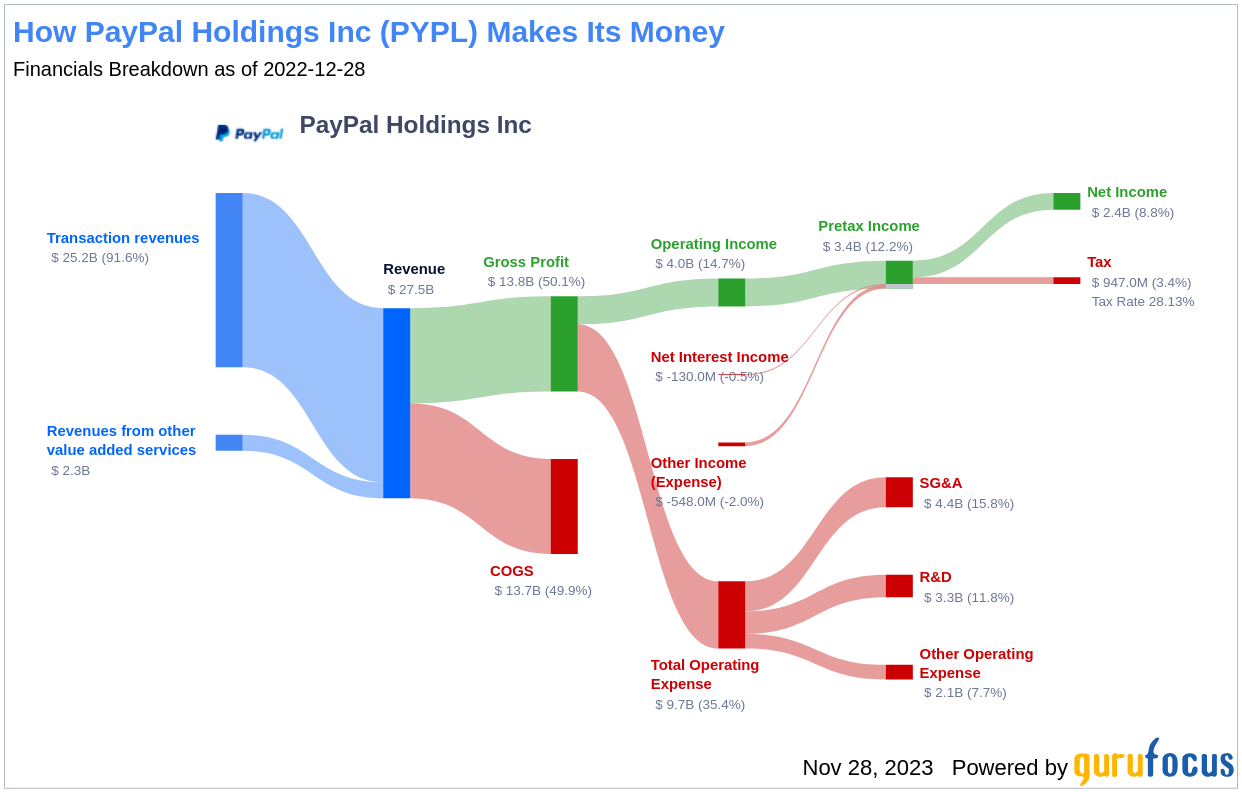
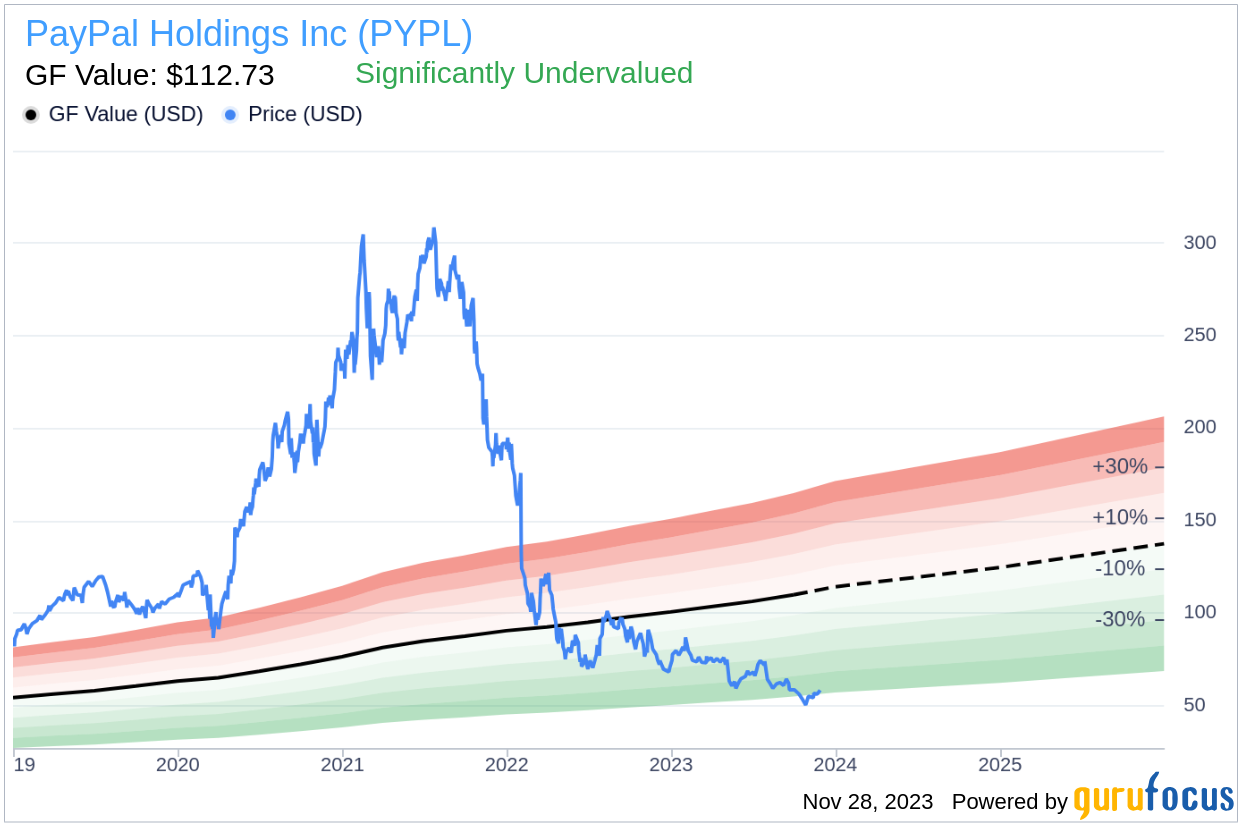
PayPal Holdings Inc (PYPL) was established as an independent entity when it was spun off from eBay in 2015. The company excels in providing electronic payment solutions to merchants and consumers, predominantly focusing on online transactions. As of the end of 2022, PayPal boasted a robust user base with 435 million active accounts. Additionally, the company's portfolio includes Venmo, a popular person-to-person payment platform. With a current price of $58.47 and a market cap of $65.40 billion, a comparison to the Fair Value (GF Value) of $112.73 suggests that PayPal Holdings may be significantly undervalued.
Decoding the GF Value for PayPal Holdings
The GF Value is a proprietary measure that reflects the intrinsic value of a stock, incorporating historical trading multiples, a GuruFocus adjustment factor based on past performance and growth, and estimated future business performance. When the stock price of PayPal Holdings is significantly below the GF Value Line, it suggests a higher potential for future returns. Currently, at $58.47 per share with a market capitalization of $65.40 billion, PayPal Holdings is considered significantly undervalued according to the GF Value. This discrepancy implies that the long-term return of PayPal Holdings' stock could outpace its business growth.
Link: These companies may deliver higher future returns at reduced risk.
Financial Strength of PayPal Holdings
When considering an investment, the financial strength of a company is a crucial factor. Companies with weak financials pose a higher risk of permanent loss. PayPal Holdings' cash-to-debt ratio of 1.09 is more favorable than 70.06% of its peers in the Credit Services industry, indicating a fair financial strength with a score of 6 out of 10.
Profitability and Growth Prospects
Investing in profitable companies, especially those with consistent long-term profitability, tends to be less risky. PayPal Holdings has a solid track record with 10 years of profitability. The company's operating margin stands at 16.47%, reflecting strong profitability with a rank of 10 out of 10. The 3-year average annual revenue growth rate of 16.7% positions PayPal Holdings favorably against 72.8% of companies in the Credit Services industry. However, its 3-year average EBITDA growth rate of 8.3% is less impressive, ranking below 51.57% of its industry peers.
ROIC vs. WACC: A Measure of Profitability
Comparing a company's Return on Invested Capital (ROIC) to its Weighted Average Cost of Capital (WACC) can provide insights into its profitability. Ideally, ROIC should exceed WACC, indicating efficient capital management. PayPal Holdings' ROIC of 16.96 is higher than its WACC of 12.11, suggesting a favorable profitability scenario.
Conclusion: PayPal Holdings' Valuation Outlook
In conclusion, PayPal Holdings Inc (PYPL, Financial) appears to be significantly undervalued, with fair financial health and impressive profitability. While its growth ranks below some industry peers, the company's strong ROIC compared to WACC indicates effective capital management. For a more in-depth look at PayPal Holdings' financials, interested investors can explore the 30-Year Financials here.
To discover high-quality companies that may deliver above-average returns, check out the GuruFocus High Quality Low Capex Screener.
This article, generated by GuruFocus, is designed to provide general insights and is not tailored financial advice. Our commentary is rooted in historical data and analyst projections, utilizing an impartial methodology, and is not intended to serve as specific investment guidance. It does not formulate a recommendation to purchase or divest any stock and does not consider individual investment objectives or financial circumstances. Our objective is to deliver long-term, fundamental data-driven analysis. Be aware that our analysis might not incorporate the most recent, price-sensitive company announcements or qualitative information. GuruFocus holds no position in the stocks mentioned herein.