

Ingersoll Rand Inc (IR, Financial) has experienced a daily gain of 0.91% and a three-month gain of 7.79%, reflecting a positive trend in its market performance. With an Earnings Per Share (EPS) of $1.87, investors are keen to understand if the stock is fairly valued. This article provides a detailed valuation analysis to determine whether Ingersoll Rand (IR) is trading at a fair market price.
Company Introduction
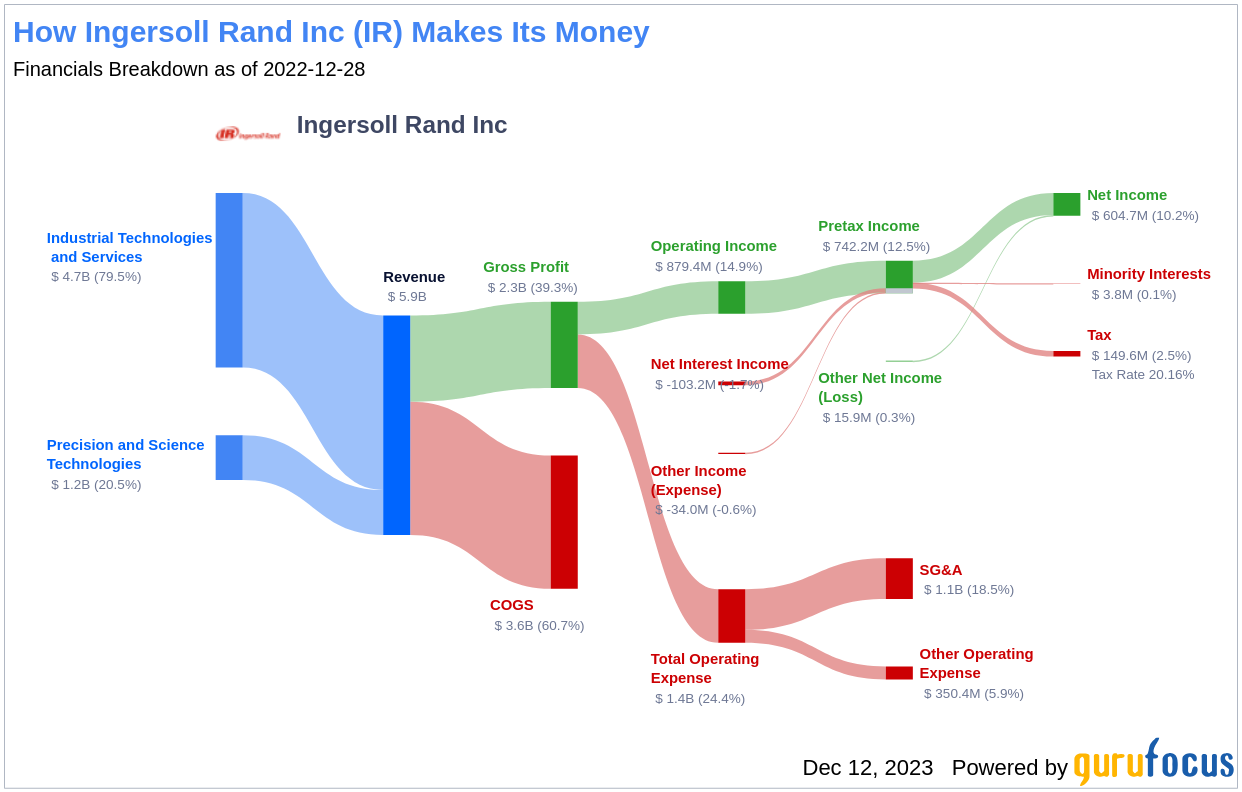
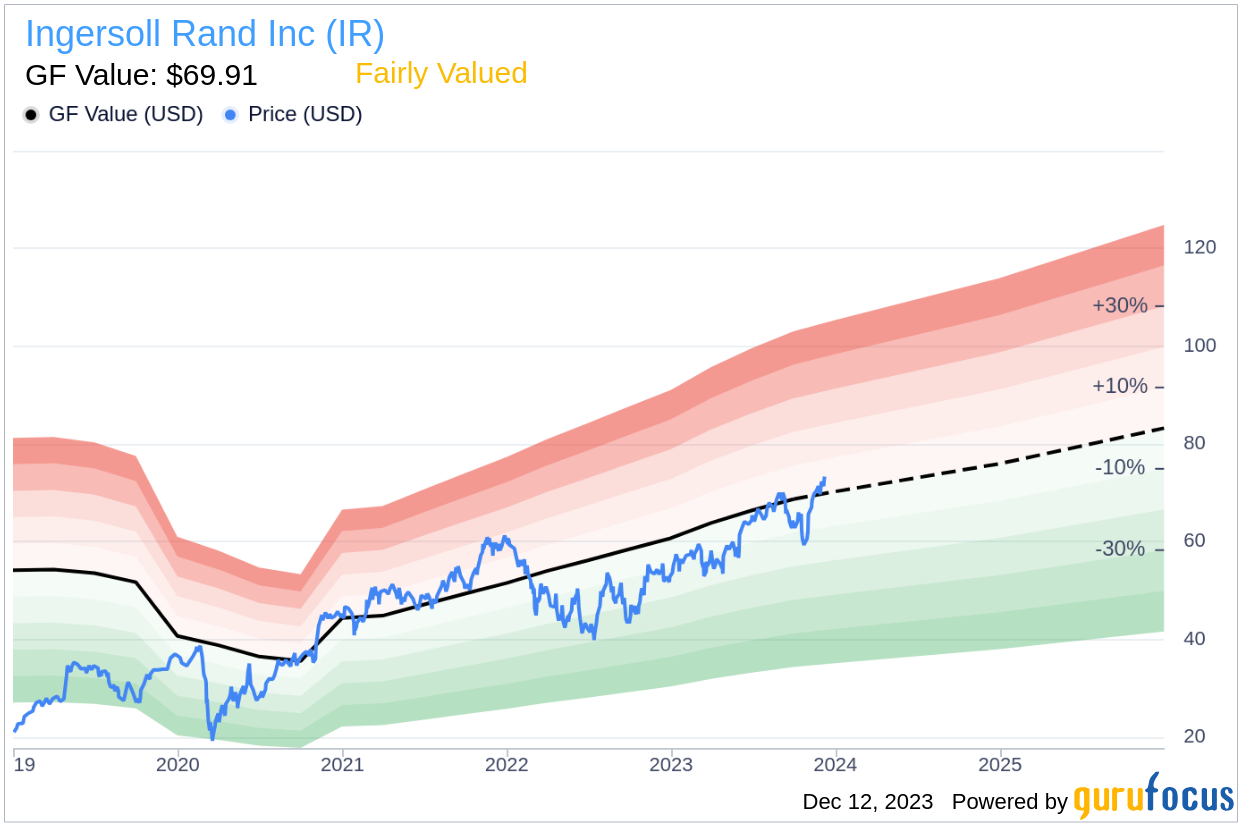
Ingersoll Rand was formed through the strategic merger of Gardner Denver and Ingersoll Rand's industrial segment. The company's diversified portfolio spans industrial technologies and services to precision and science technologies, catering to a wide array of end markets including industrial, medical, and energy sectors. With a history of innovation and a broad range of products in compression, blower and vacuum, and fluid management, Ingersoll Rand generated approximately $5.9 billion in revenue in 2022. As we delve into the financials, a comparison between the current stock price of $73.98 and the GF Value of $69.91 will reveal the intrinsic value of Ingersoll Rand.
Summarize GF Value
The GF Value is a proprietary calculation used to determine the intrinsic value of a stock. It incorporates historical trading multiples, a GuruFocus adjustment factor based on past performance and growth, and future business performance estimates. When a stock's price aligns closely with the GF Value Line, it is considered fairly valued, suggesting that its future returns will likely mirror the company's business growth. In the case of Ingersoll Rand (IR, Financial), with a market cap of $29.90 billion, the stock appears to be fairly valued at the current price. This suggests that the long-term return of Ingersoll Rand's stock may closely reflect the company's growth trajectory.
Link: These companies may deliver higher future returns at reduced risk.
Financial Strength
Assessing the financial strength of a company is crucial before investing. Ingersoll Rand has a cash-to-debt ratio of 0.43, which, although lower than many of its peers, still indicates fair financial health with a strength rating of 7 out of 10. This suggests that while there may be some risk associated with the company's debt levels, its overall financial condition is sound.
Profitability and Growth
Profitability is a key indicator of a company's financial health. Ingersoll Rand has consistently demonstrated profitability over the past decade. With a 12-month revenue of $6.70 billion and an Earnings Per Share (EPS) of $1.87, along with an impressive operating margin of 17.63%, the company's profitability is ranked at 6 out of 10. This indicates a fair level of profitability.
Growth is also a critical component of a company's valuation. Ingersoll Rand's 3-year average annual revenue growth rate of 14.3% and an EBITDA growth rate of 23.6% outperform the majority of its industry peers, suggesting a strong potential for future value creation for shareholders.
ROIC vs WACC
Comparing a company's Return on Invested Capital (ROIC) to its Weighted Average Cost of Capital (WACC) is another way to evaluate profitability. Although Ingersoll Rand's ROIC of 7.46 is currently lower than its WACC of 11.7, this metric alone doesn't fully capture the company's long-term potential or its strategic initiatives that may enhance future performance.
Conclusion
In summary, Ingersoll Rand (IR, Financial) is currently trading at a price that suggests it is fairly valued. The company's fair financial condition and profitability, combined with better than average industry growth rates, make it an interesting prospect for investors. To gain a deeper understanding of Ingersoll Rand's financial health and potential, one can examine its 30-Year Financials here.
To discover high-quality companies that may deliver above-average returns, please check out the GuruFocus High Quality Low Capex Screener.
This article, generated by GuruFocus, is designed to provide general insights and is not tailored financial advice. Our commentary is rooted in historical data and analyst projections, utilizing an impartial methodology, and is not intended to serve as specific investment guidance. It does not formulate a recommendation to purchase or divest any stock and does not consider individual investment objectives or financial circumstances. Our objective is to deliver long-term, fundamental data-driven analysis. Be aware that our analysis might not incorporate the most recent, price-sensitive company announcements or qualitative information. GuruFocus holds no position in the stocks mentioned herein.