

With a daily change of 0% and a 3-month gain of 7.86%, Apple Inc (AAPL, Financial) maintains a steady position in the market. The company's Earnings Per Share (EPS) stands at 6.12, reflecting its financial performance. Investors often ponder whether such a stock is fairly valued. To address this, we delve into a comprehensive valuation analysis of Apple (AAPL), assessing whether its current market price aligns with its intrinsic value.
Company Introduction
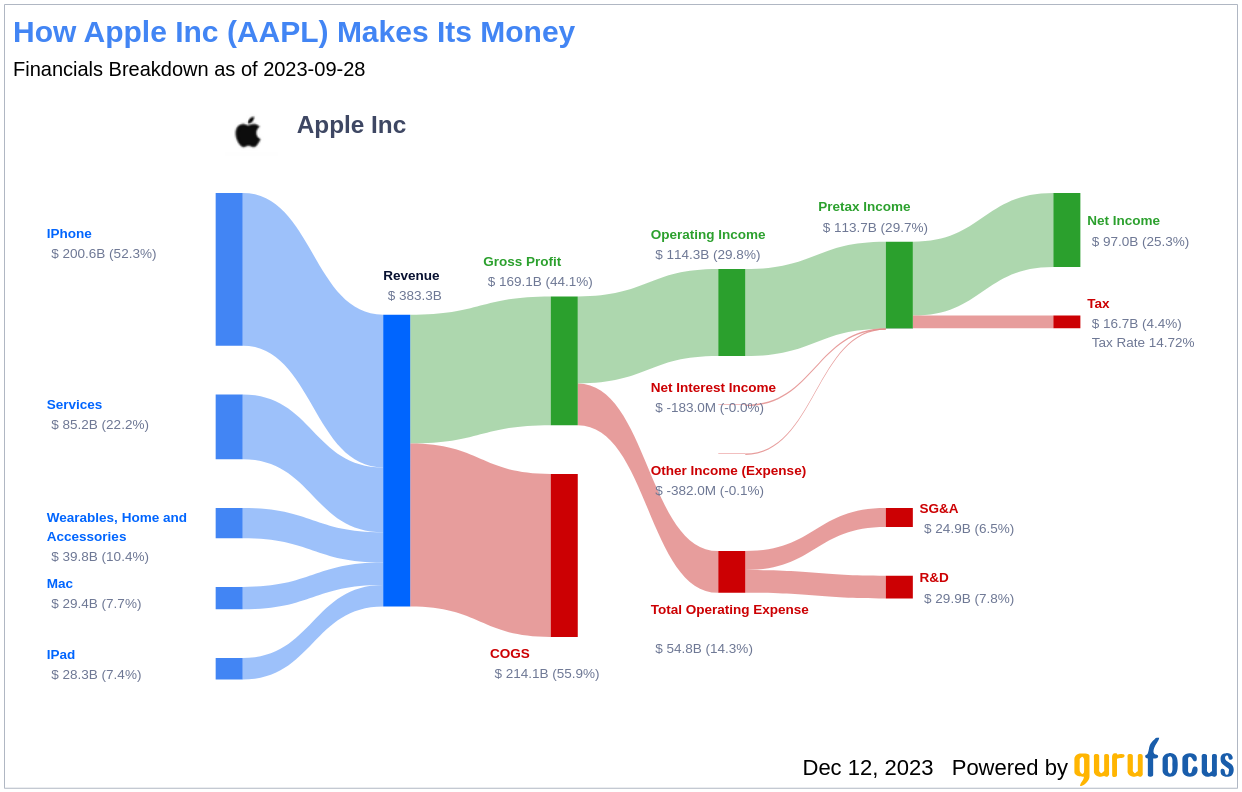
Apple Inc (AAPL, Financial) is a technological behemoth, with a vast array of hardware and software products that cater to both consumer and business markets. With the iPhone accounting for a significant portion of the company's sales, Apple's other offerings, including Mac, iPad, and Watch, are intricately connected within an expansive software ecosystem. Continuously innovating, Apple has introduced new services such as streaming video, subscription bundles, and augmented reality. The company's unique approach to design, coupled with strategic partnerships with manufacturers like Foxconn and TSMC, enables it to maintain a leading edge in the industry. Roughly half of Apple's sales are made through its flagship stores, underscoring the direct relationship it fosters with its customers.
Summarize GF Value
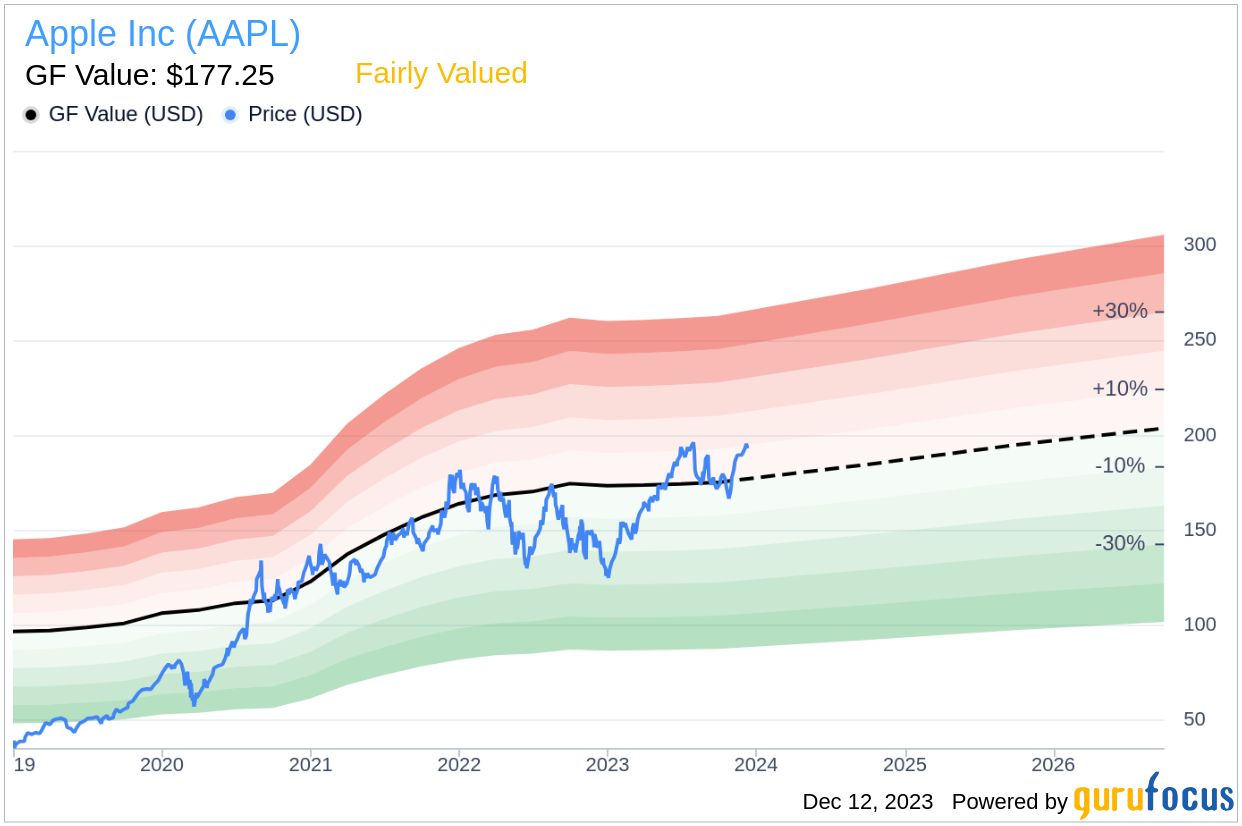
The GF Value is a unique metric that represents the intrinsic value of a stock, based on a proprietary formula. This value is influenced by historical trading multiples, such as PE Ratio, PS Ratio, PB Ratio, and Price-to-Free-Cash-Flow, as well as a GuruFocus adjustment factor that accounts for the company's historical performance and growth. Additionally, it includes analyst estimates of future business performance. If Apple's stock trades significantly above the GF Value Line, it's considered overvalued, and conversely, if it's below, it could mean a higher future return.
At the current price of $193.18 per share and a market cap of $3 trillion, Apple Inc (AAPL, Financial) is deemed to be fairly valued. This suggests that the long-term return of its stock should closely mirror the rate of its business growth.
Link: These companies may deliver higher future returns at reduced risk.
Financial Strength
Investors must consider a company's financial strength to avoid the risk of permanent capital loss. Key indicators like the cash-to-debt ratio, which for Apple stands at 0.55, provide insights into the company's financial resilience. Although this ratio ranks lower than 69.92% of companies in the Hardware industry, Apple's overall financial strength is rated 7 out of 10, indicating a fair financial condition.
Profitability and Growth
Investing in profitable companies, especially those with a history of consistent profitability, is typically less risky. Apple's impressive operating margin of 29.82% outperforms 98.13% of its industry peers, underscoring its strong profitability. The company's profitability rank is a solid 10 out of 10. In terms of growth, Apple's 3-year average annual revenue growth rate of 15.7% is commendable, surpassing 79.68% of companies in the Hardware industry. Its EBITDA growth rate of 20.9% also indicates a strong potential for value creation.
ROIC vs WACC
Comparing a company's Return on Invested Capital (ROIC) with its Weighted Average Cost of Capital (WACC) is crucial for evaluating profitability. Apple's ROIC of 32.86 significantly exceeds its WACC of 11.51, indicating efficient cash flow generation and value creation for shareholders.
Conclusion
In summary, Apple Inc (AAPL, Financial) is currently fairly valued, with a solid financial foundation and robust profitability. The company's growth outpaces a majority of its competitors in the Hardware industry. For a detailed look at Apple's financials over the last 30 years, you can explore their financial statements here.
To discover high-quality companies that may deliver above-average returns, check out the GuruFocus High Quality Low Capex Screener.
This article, generated by GuruFocus, is designed to provide general insights and is not tailored financial advice. Our commentary is rooted in historical data and analyst projections, utilizing an impartial methodology, and is not intended to serve as specific investment guidance. It does not formulate a recommendation to purchase or divest any stock and does not consider individual investment objectives or financial circumstances. Our objective is to deliver long-term, fundamental data-driven analysis. Be aware that our analysis might not incorporate the most recent, price-sensitive company announcements or qualitative information. GuruFocus holds no position in the stocks mentioned herein.