

Molina Healthcare Inc (MOH, Financial) has recently shown a daily gain of 3.41%, with an impressive 3-month gain of 17.67%. With an Earnings Per Share (EPS) of $16.04, investors are keen to understand if the stock is fairly valued. This article delves into the valuation analysis of Molina Healthcare, exploring whether its current market price reflects its true worth. Read on for an in-depth valuation analysis that aims to answer this pivotal question.
Company Introduction
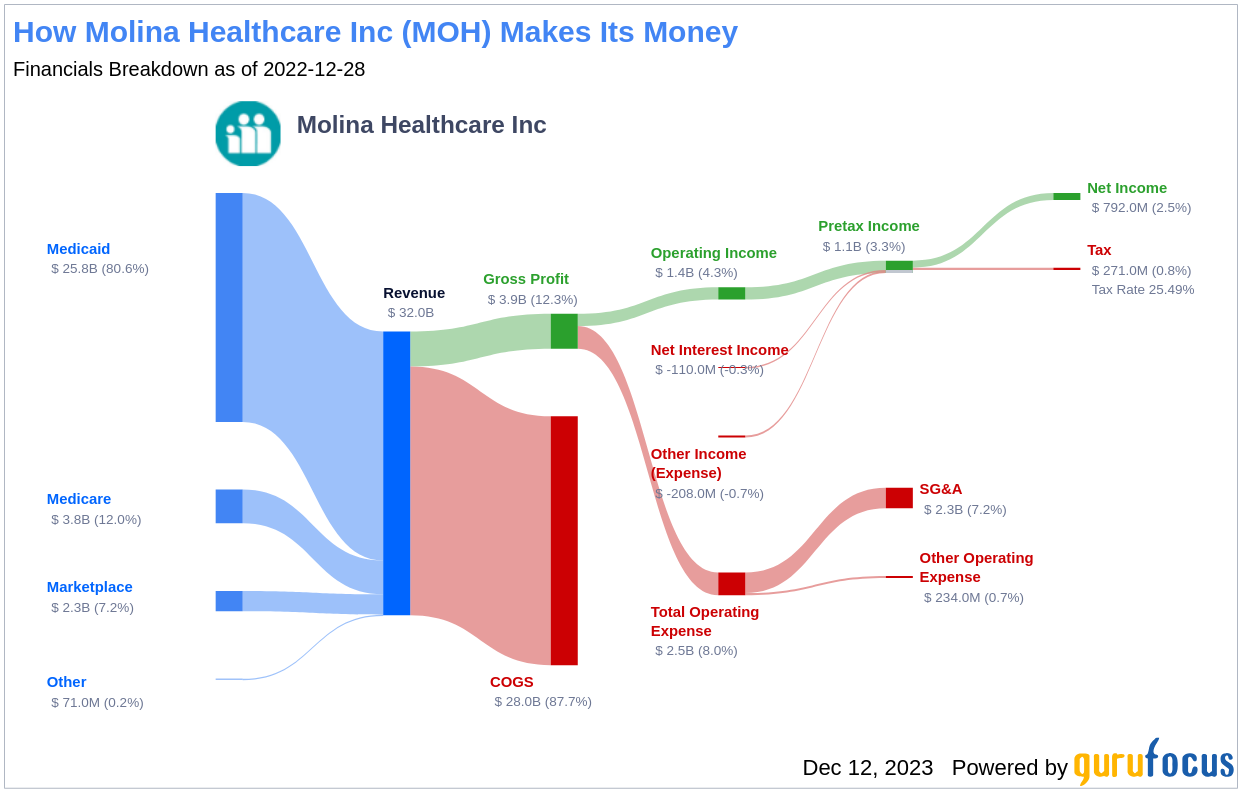
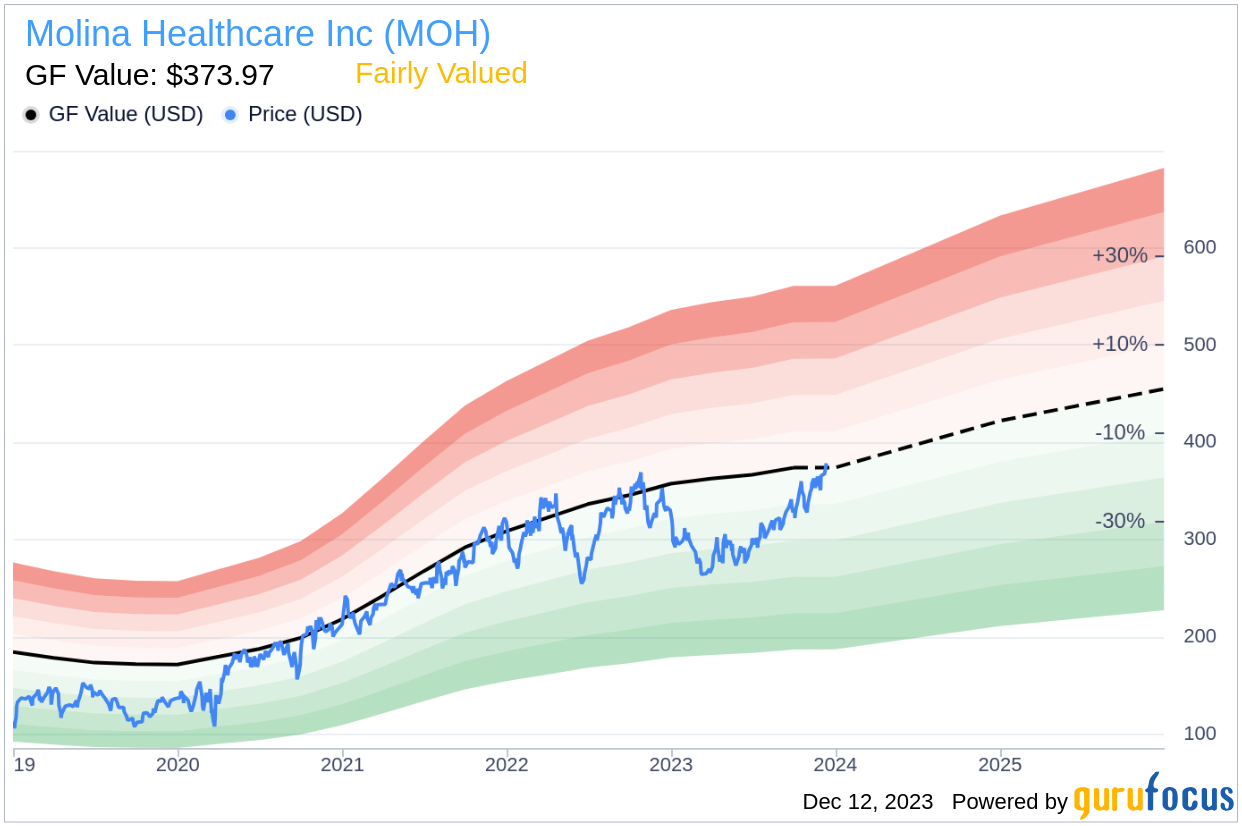
Molina Healthcare Inc offers healthcare plans primarily focused on Medicaid-related services for low-income families and individuals. With a diverse network of subsidiaries licensed as health maintenance organizations (HMOs), Molina Healthcare operates across various segments including Medicaid, Medicare, and Marketplace. The company's revenue streams are predominantly from state government agencies on a per-member per-month basis, and from managed care plans contracted with the Centers for Medicaid and Medicare Services (CMS). Analyzing Molina Healthcare's stock price of $378.48 against the GF Value of $373.97 provides a critical starting point to assess the company's fair market value.
Summarize GF Value
The GF Value is a proprietary metric that indicates the intrinsic value of a stock, blending historical trading multiples, an adjustment factor based on past performance, and future business performance estimates. When a stock trades significantly above this value, it may be overvalued, suggesting poorer future returns. Conversely, trading below the GF Value may indicate undervaluation and the potential for higher returns. Molina Healthcare (MOH, Financial) is currently trading at a price that suggests it is fairly valued, implying that its stock price is likely to follow the trajectory of the company's business growth.
Financial Strength Assessment
Investors must consider a company's financial strength to avoid the risk of permanent capital loss. Molina Healthcare's cash-to-debt ratio of 4.07, ranking above 68.42% of peers in the Healthcare Plans industry, suggests a robust financial position. With an overall financial strength rating of 8 out of 10, Molina Healthcare stands as a strong contender within its sector.
Profitability and Growth
Investing in profitable companies, especially those with consistent long-term profitability, tends to be less risky. Molina Healthcare has maintained profitability for 9 out of the past 10 years, with a revenue of $33.20 billion and an Earnings Per Share (EPS) of $16.04 over the last twelve months. Its operating margin of 4.72% ranks well within its industry, indicating strong profitability with an 8 out of 10 rating. When considering growth, Molina Healthcare's 3-year average annual revenue growth rate of 27.8% outperforms 72.22% of its industry peers, further solidifying its position as a valuable investment.
ROIC vs WACC Analysis
A critical profitability metric is the comparison of a company's Return on Invested Capital (ROIC) against its Weighted Average Cost of Capital (WACC). Molina Healthcare's ROIC of 41.23 substantially exceeds its WACC of 8.06, indicating efficient value creation for shareholders. This relationship between ROIC and WACC is a strong indicator of the company's profitability and potential for growth.
Conclusion
In conclusion, Molina Healthcare (MOH, Financial) appears to be fairly valued, reflecting its strong financial condition and robust profitability. With growth rates surpassing a majority of competitors in the Healthcare Plans industry, Molina Healthcare is poised for continued success. For a detailed look at the company's financials, investors can explore Molina Healthcare's 30-Year Financials here.
Discover High-Quality Investments
To identify high-quality companies that may deliver above-average returns, consider using the GuruFocus High Quality Low Capex Screener.
This article, generated by GuruFocus, is designed to provide general insights and is not tailored financial advice. Our commentary is rooted in historical data and analyst projections, utilizing an impartial methodology, and is not intended to serve as specific investment guidance. It does not formulate a recommendation to purchase or divest any stock and does not consider individual investment objectives or financial circumstances. Our objective is to deliver long-term, fundamental data-driven analysis. Be aware that our analysis might not incorporate the most recent, price-sensitive company announcements or qualitative information. GuruFocus holds no position in the stocks mentioned herein.