

Value-focused investors are always on the lookout for bargain opportunities in the stock market. Boston Properties Inc (BXP, Financial) is one such stock that may appear undervalued at a glance. With its current price at $68.09 and a recent day's gain of 8.51%, alongside a three-month increase of 8.5%, the figures suggest a promising trajectory. However, the GF Value pegs the stock's fair valuation at $106.48, hinting at a potential undervaluation. But is this discrepancy a sign of an overlooked investment gem, or is it a trap waiting to snare unwary investors?
Understanding the GF Value
The GF Value is a unique metric designed to estimate the intrinsic value of a stock. It integrates historical trading multiples, such as PE, PS, PB ratios, and Price-to-Free-Cash-Flow, with an adjustment factor based on past performance and growth, as well as future business projections. Ideally, the stock price should oscillate around this value line, with prices above indicating overvaluation and those below suggesting undervaluation and a higher potential return.
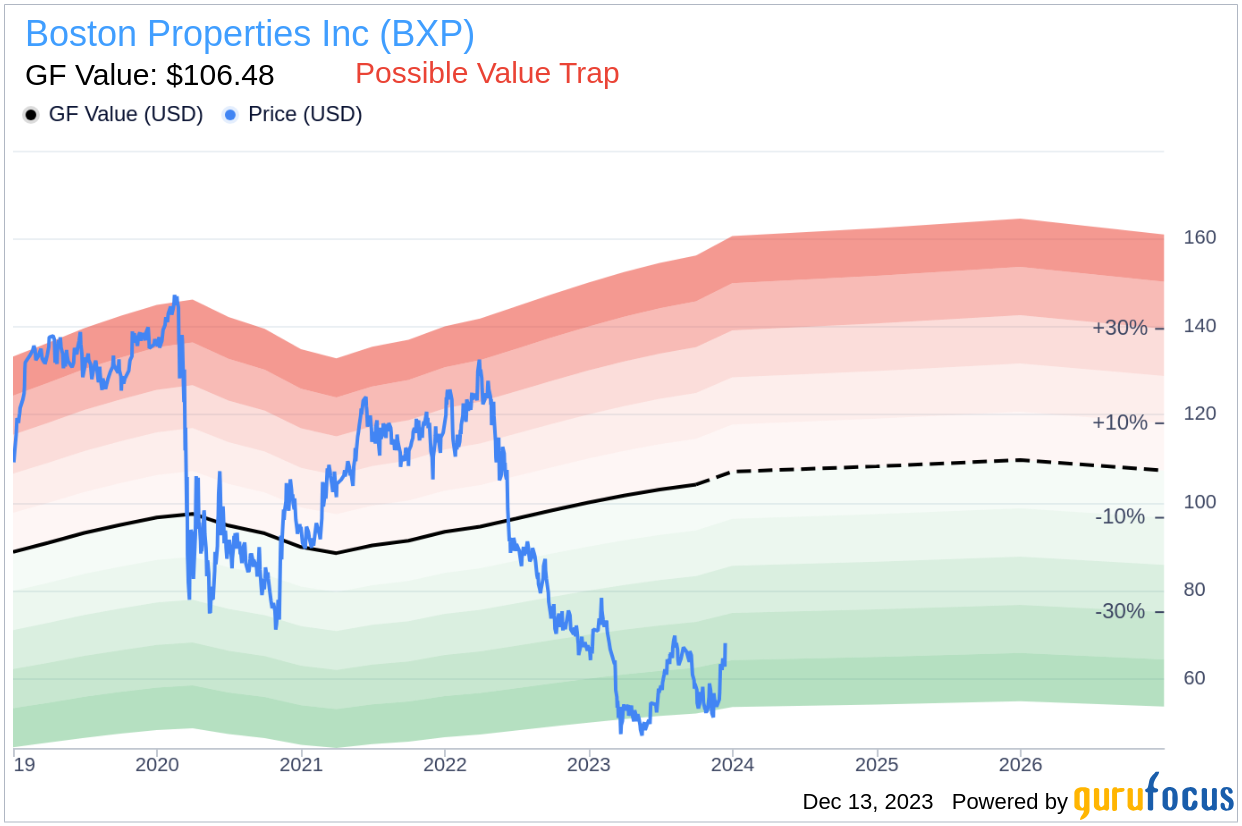
While Boston Properties' price falls significantly below its GF Value, prudent investors must dig deeper. The company's financial health, reflected by metrics such as the low Altman Z-score of 0.64, raises red flags that warrant a cautious approach. Such indicators suggest that despite the apparent undervaluation, Boston Properties could be a potential value trap, emphasizing the need for comprehensive due diligence.
Deciphering the Altman Z-Score
The Altman Z-score is a predictive model that assesses the likelihood of a company facing bankruptcy in the near future. A score below 1.8 signals high risk, whereas a score above 3 implies financial stability. Boston Properties' Z-score of 0.64 is a stark warning, indicating a high probability of financial distress and making the case for its classification as a potential value trap even stronger.
Boston Properties Inc (BXP, Financial) Snapshot
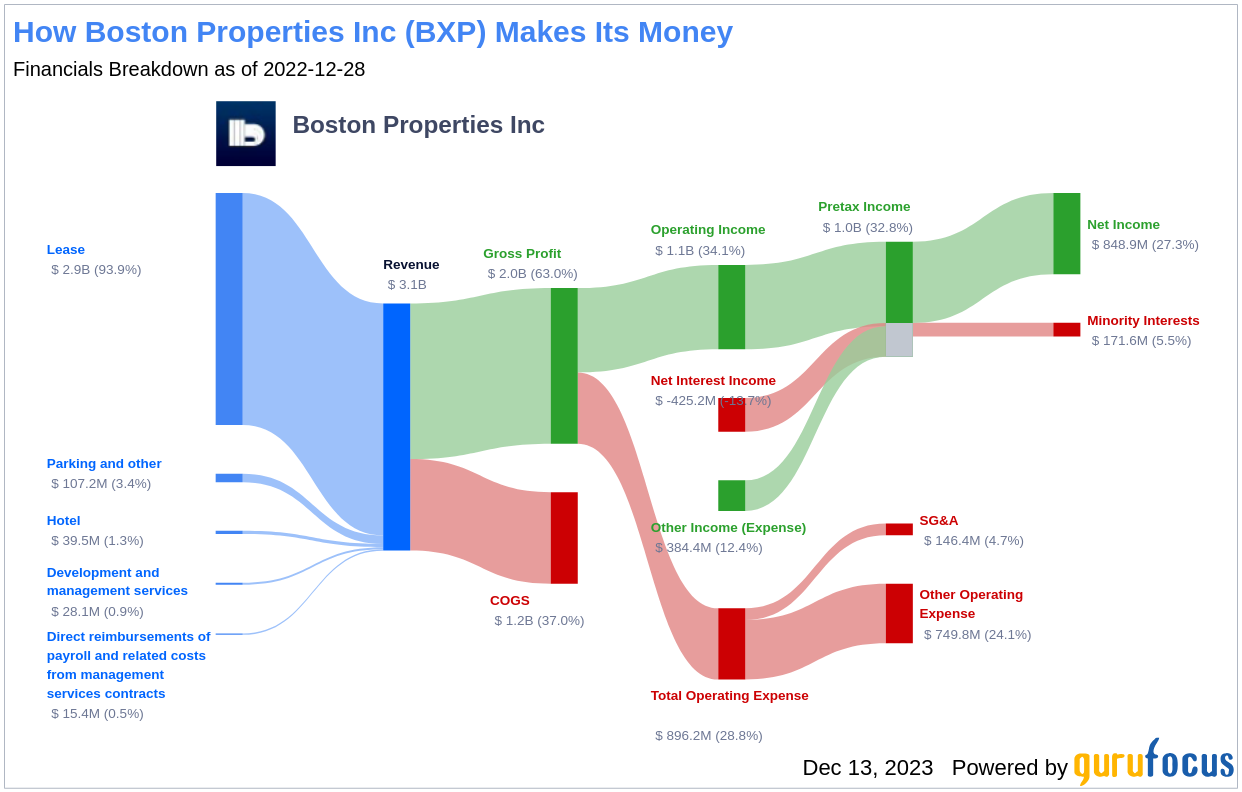
Boston Properties owns a vast portfolio of over 190 properties, amounting to approximately 54 million rentable square feet, predominantly in office buildings across key U.S. cities. Despite the impressive portfolio, the company's market cap of $10.70 billion and sales of $3.20 billion need to be weighed against its GF Value to determine if the current market price truly reflects its worth.
Scrutinizing Boston Properties' Financial Health
An analysis of Boston Properties' financial ratios paints a concerning picture. The company's Retained Earnings to Total Assets ratio has shown a declining trend over the past three years, with figures of -0.03 in 2021 and 2023, and -0.02 in 2022. This pattern suggests a weakening ability to reinvest or manage debt effectively, impacting the Altman Z-Score negatively.
Similarly, the EBIT to Total Assets ratio, a measure of operational efficiency, has been inconsistent, with a decrease from 0.06 in 2022 to 0.03 in 2023. This indicates that Boston Properties may not be leveraging its assets to maximize operational profits, further contributing to the potential value trap scenario.
Is Boston Properties a Value Trap?
Despite its attractive price relative to the GF Value, Boston Properties' financial metrics, including a low Altman Z-score, suggest that the company could be facing financial challenges. These warning signs underscore the importance of not judging a stock solely by its price-to-value ratio. Investors must consider the underlying financial health and stability of the company to avoid falling into a value trap.
For GuruFocus Premium members seeking to avoid such pitfalls, the Walter Schloss Screen can be a valuable tool for identifying stocks with high Altman Z-Scores, signaling stronger financial positions.
In conclusion, while Boston Properties may seem like a bargain at first glance, the financial indicators suggest caution. Before committing capital, investors should thoroughly analyze the company's financials and consider the broader market context. Could Boston Properties be a wise investment or a value trap in disguise? The answer lies in the details of its financial health.
This article, generated by GuruFocus, is designed to provide general insights and is not tailored financial advice. Our commentary is rooted in historical data and analyst projections, utilizing an impartial methodology, and is not intended to serve as specific investment guidance. It does not formulate a recommendation to purchase or divest any stock and does not consider individual investment objectives or financial circumstances. Our objective is to deliver long-term, fundamental data-driven analysis. Be aware that our analysis might not incorporate the most recent, price-sensitive company announcements or qualitative information. GuruFocus holds no position in the stocks mentioned herein.