

Vertex Pharmaceuticals Inc (VRTX, Financial) recently experienced a notable daily gain of 13.21%, complementing a three-month gain of 16.45%. With an impressive Earnings Per Share (EPS) of 13.33, investors are keenly observing the stock's performance. However, the critical question remains: Is Vertex Pharmaceuticals modestly overvalued? This article delves into the valuation analysis of Vertex Pharmaceuticals, offering readers a comprehensive understanding of its current market standing.
Company Introduction
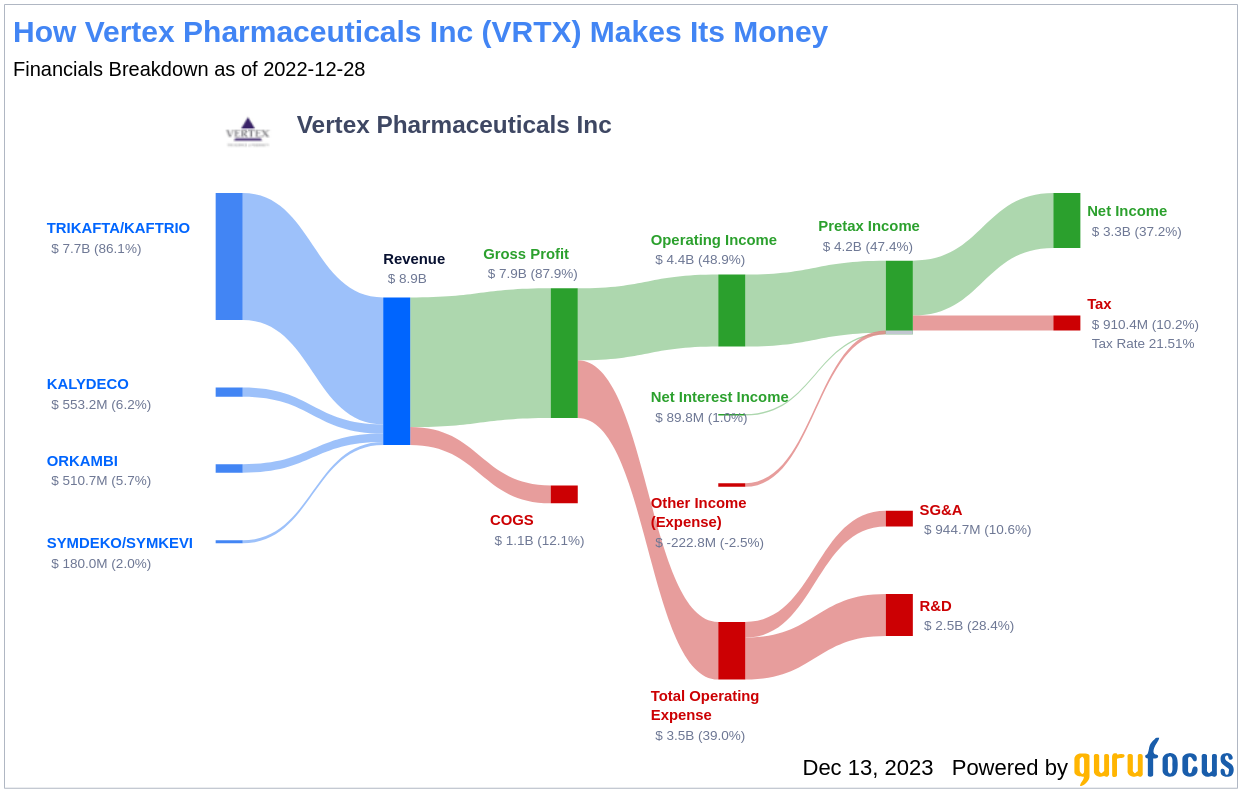
Vertex Pharmaceuticals Inc (VRTX, Financial) is a pioneering force in the biotechnology field, focusing on the discovery and development of innovative small-molecule drugs. With flagship treatments for cystic fibrosis, such as Kalydeco, Orkambi, Symdeko, and Trikafta/Kaftrio, Vertex Pharmaceuticals has established a dominant position in the market. The company is also expanding its pipeline with gene-editing therapies and nonopioid treatments for pain and kidney diseases, as well as cell therapies for type 1 diabetes. With a current stock price of $404.97 and a market cap of $104.40 billion, it's essential to assess whether the company's valuation aligns with its intrinsic value.
Summarize GF Value
The GF Value provides an estimation of the intrinsic value of a stock, incorporating historical trading multiples, a GuruFocus adjustment factor, and future business performance forecasts. This proprietary measure suggests an ideal trading value for the stock. When a stock's price significantly exceeds the GF Value Line, it may be considered overvalued, potentially leading to poorer future returns. Conversely, prices below the GF Value Line could indicate higher future returns. Currently, with a GF Value of $343, Vertex Pharmaceuticals Inc (VRTX, Financial) appears to be modestly overvalued.
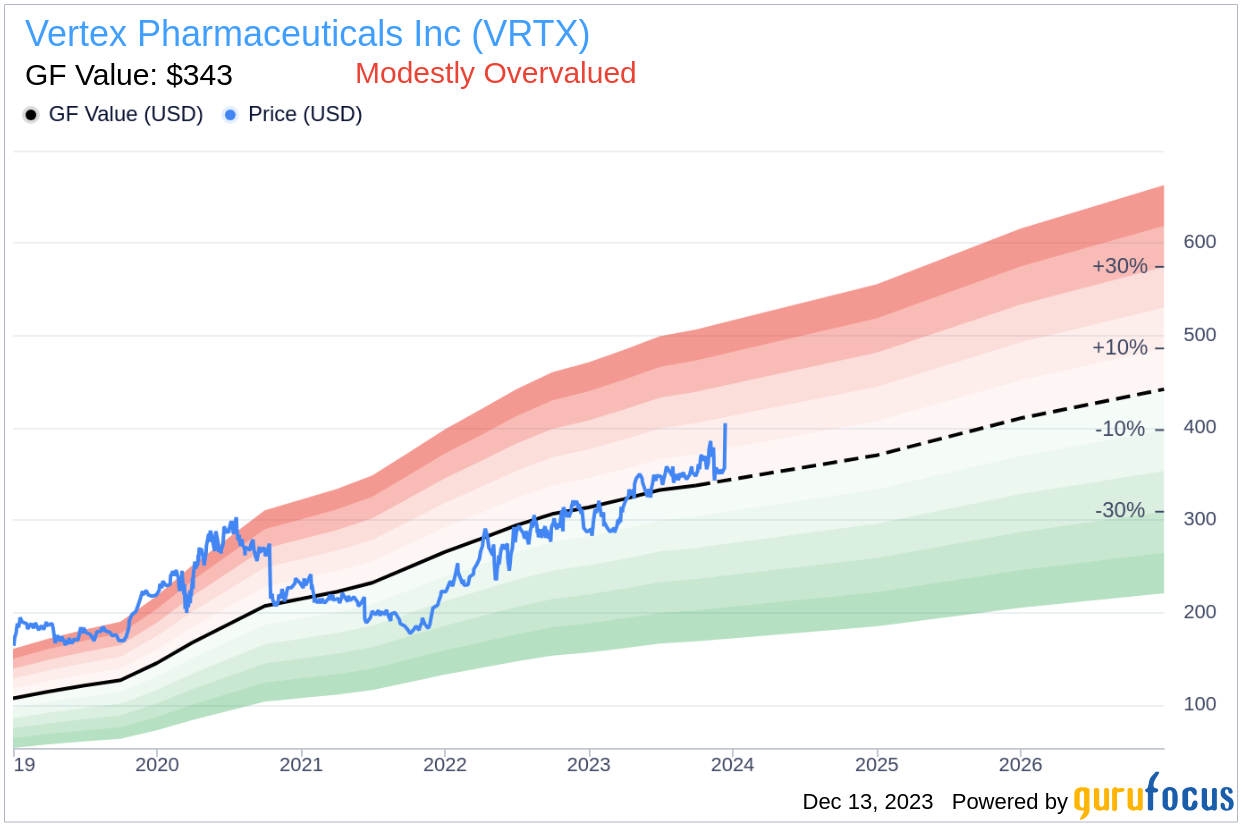
As a result of being relatively overvalued, the long-term return of Vertex Pharmaceuticals' stock may not align with the company's business growth.
Link: These companies may deliver higher future returns at reduced risk.
Financial Strength
Investing in companies with robust financial strength is crucial to avoid permanent capital loss. Vertex Pharmaceuticals boasts a cash-to-debt ratio of 16.02, placing it ahead of 62.06% of its peers in the Biotechnology industry. This impressive ratio has earned the company a financial strength rating of 10 out of 10, indicating a solid balance sheet.
Profitability and Growth
Profitability is a key indicator of a company's investment potential, with high profit margins often signaling a safer investment. Vertex Pharmaceuticals has maintained profitability for 6 out of the past 10 years. With annual revenue of $9.70 billion and an operating margin of 45.67%, the company stands out in the Biotechnology industry, reflecting strong profitability with a rank of 8 out of 10.
Growth is intimately tied to a company's long-term stock performance. Vertex Pharmaceuticals' 3-year average annual revenue growth of 29.2% is commendable, surpassing 73.39% of its industry counterparts. Moreover, its EBITDA growth rate of 42% ranks higher than 87.04% of companies in the same sector.
ROIC vs WACC
An effective measure of a company's profitability is the comparison between its Return on Invested Capital (ROIC) and Weighted Average Cost of Capital (WACC). Ideally, ROIC should exceed WACC, indicating efficient cash flow generation relative to the capital invested. Vertex Pharmaceuticals excels with a ROIC of 58.24, significantly higher than its WACC of 6.11.
Conclusion
In conclusion, Vertex Pharmaceuticals (VRTX, Financial) exhibits signs of being modestly overvalued. The company's financial condition and profitability are robust, with growth rates that outperform a significant portion of the Biotechnology industry. For a detailed analysis of Vertex Pharmaceuticals' financials, interested parties can explore the 30-Year Financials here.
High Quality, Low Capex Screener
To discover high-quality companies that may deliver above-average returns, please visit the GuruFocus High Quality Low Capex Screener.
This article, generated by GuruFocus, is designed to provide general insights and is not tailored financial advice. Our commentary is rooted in historical data and analyst projections, utilizing an impartial methodology, and is not intended to serve as specific investment guidance. It does not formulate a recommendation to purchase or divest any stock and does not consider individual investment objectives or financial circumstances. Our objective is to deliver long-term, fundamental data-driven analysis. Be aware that our analysis might not incorporate the most recent, price-sensitive company announcements or qualitative information. GuruFocus holds no position in the stocks mentioned herein.