

Amidst the daily fluctuations of the stock market, Bath & Body Works Inc (BBWI, Financial) has experienced a notable 3-month gain of 34.99%, despite a slight daily loss of -1.35%. With an Earnings Per Share (EPS) of $3.19, investors are keen to understand: is Bath & Body Works Inc (BBWI) fairly valued at its current price? To answer this, we delve into a comprehensive valuation analysis, inviting readers to explore the financial intricacies that determine the true worth of Bath & Body Works (BBWI).
Company Overview
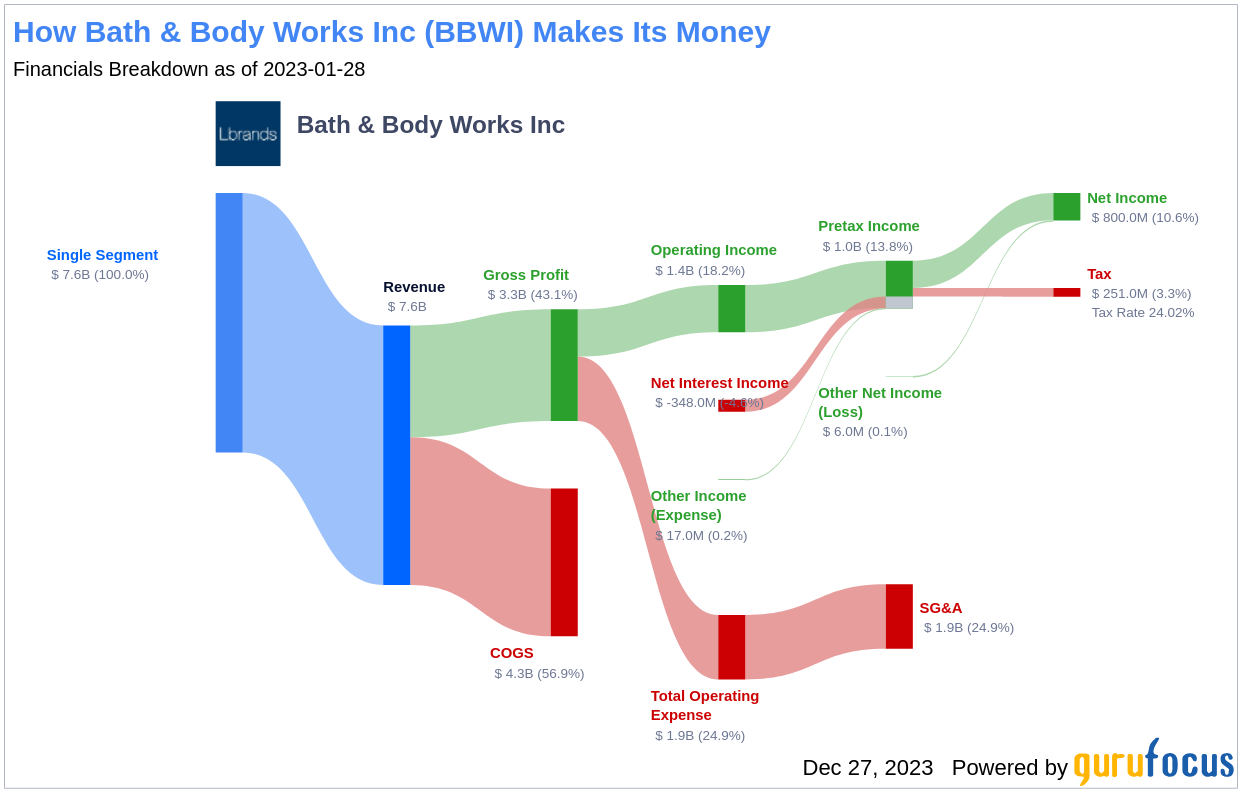
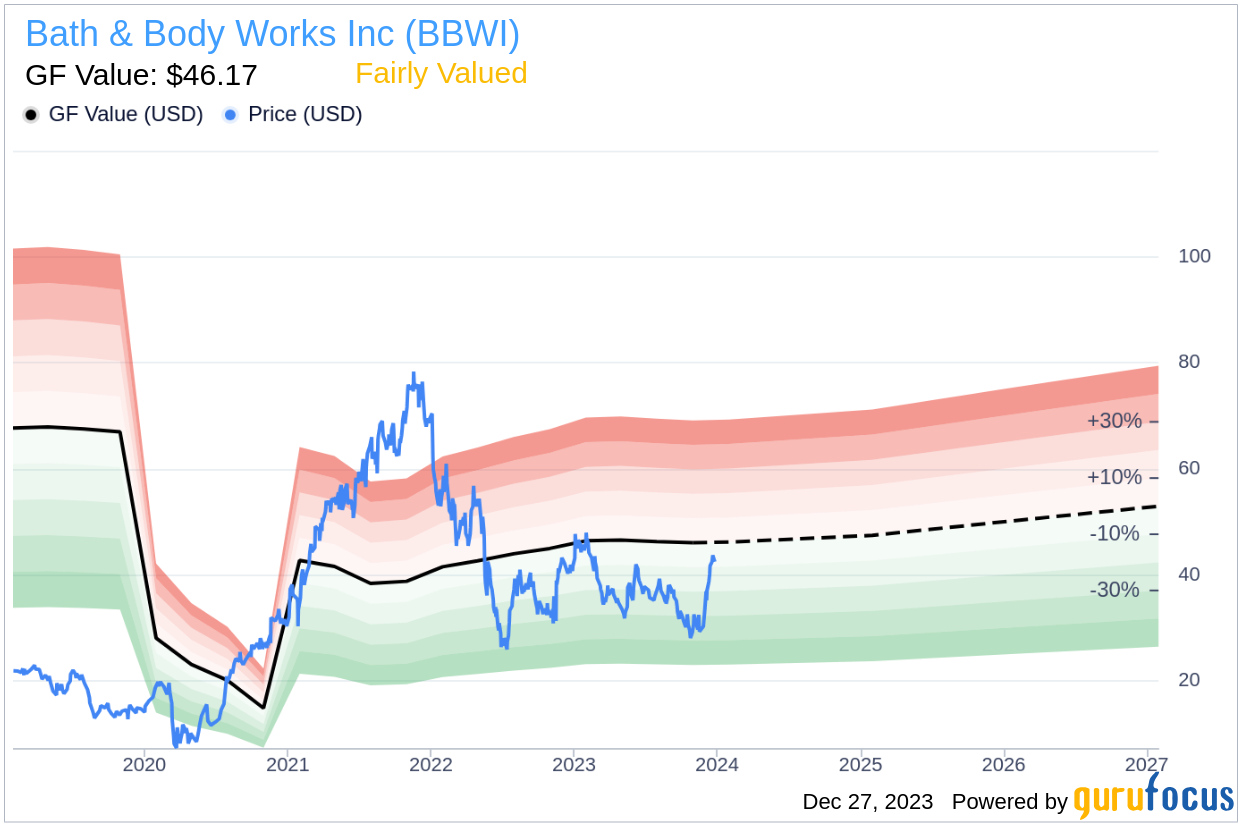
Bath & Body Works Inc (BBWI, Financial) is a leading specialty retailer known for its home fragrance products and fragrant body care lines. With a strong presence in North America and a modest footprint internationally, Bath & Body Works (BBWI) has maintained a significant portion of its sales through its extensive brick-and-mortar network, complemented by digital and international channels. As the company navigates through store reformatting and category expansion, we compare its current stock price of $42.51 to the GF Value of $46.17—an estimate of its fair value—to gauge its investment potential.
Understanding the GF Value
The GF Value is a unique measure of a stock's intrinsic value, incorporating historical trading multiples, a GuruFocus adjustment factor based on past performance and growth, and future business performance projections. It serves as a benchmark for the stock's fair trading value. If Bath & Body Works (BBWI, Financial)'s stock price substantially exceeds the GF Value Line, it could be considered overvalued, suggesting weaker future returns. Conversely, a price well below the GF Value Line may indicate undervaluation and the potential for higher returns.
Presently, Bath & Body Works (BBWI, Financial) is deemed fairly valued by the GuruFocus valuation method. This suggests that the stock's long-term return may align closely with the company's business growth rate. Here's a visual representation of the GF Value for Bath & Body Works:
Financial Strength Analysis
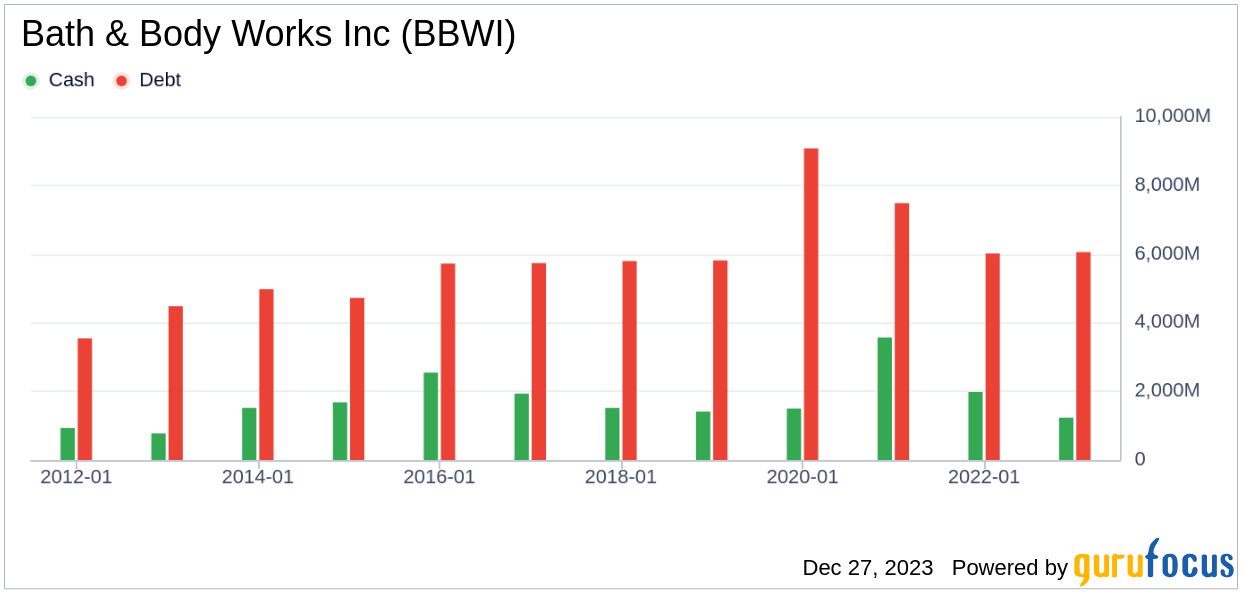
Investors must consider a company's financial strength to mitigate the risk of capital loss. Key indicators such as the cash-to-debt ratio and interest coverage provide insight into financial robustness. Bath & Body Works holds a cash-to-debt ratio of 0.07, ranking lower than 85.75% of its peers in the Retail - Cyclical industry. With an overall financial strength rating of 4 out of 10, the company's financial position appears to be weak. Below is a graphical depiction of the company's debt and cash over the years:
Profitability and Growth Perspectives
Investing in companies with consistent profitability and high profit margins is generally less risky. Bath & Body Works has demonstrated profitability for 9 out of the past 10 years, boasting a revenue of $7.40 billion and an Earnings Per Share (EPS) of $3.19. Its impressive operating margin of 16.77% outperforms 91.25% of its industry counterparts. The company's profitability is strong, with a ranking of 8 out of 10.
Growth is a pivotal aspect of a company's valuation, often correlating with long-term stock performance. Bath & Body Works' 3-year average annual revenue growth rate of 18.6% surpasses 80.29% of companies in the industry. However, its 3-year average EBITDA growth rate of 7.1% ranks below 52.01% of its peers, indicating mixed growth prospects.
ROIC vs. WACC: A Profitability Indicator
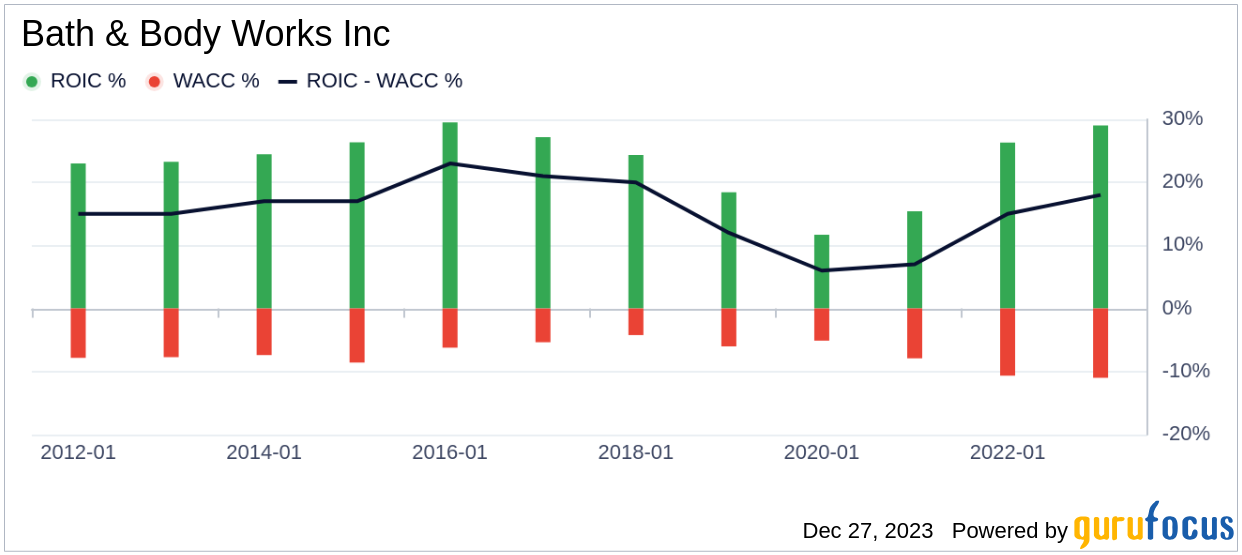
Comparing Return on Invested Capital (ROIC) to the Weighted Average Cost of Capital (WACC) reveals a company's value creation efficiency. Bath & Body Works' ROIC of 25.98 is significantly higher than its WACC of 9.5, suggesting effective value generation for shareholders. The historical comparison of ROIC vs WACC for Bath & Body Works is illustrated below:
Concluding Insights
In conclusion, Bath & Body Works (BBWI, Financial) is currently assessed as fairly valued. The company exhibits strong profitability but faces challenges in financial strength and mixed growth indicators. For a deeper understanding of Bath & Body Works' financials, interested investors can refer to its 30-Year Financials here.
To discover high-quality companies that may offer above-average returns, visit the GuruFocus High Quality Low Capex Screener.
This article, generated by GuruFocus, is designed to provide general insights and is not tailored financial advice. Our commentary is rooted in historical data and analyst projections, utilizing an impartial methodology, and is not intended to serve as specific investment guidance. It does not formulate a recommendation to purchase or divest any stock and does not consider individual investment objectives or financial circumstances. Our objective is to deliver long-term, fundamental data-driven analysis. Be aware that our analysis might not incorporate the most recent, price-sensitive company announcements or qualitative information. GuruFocus holds no position in the stocks mentioned herein.