
Long-established in the Medical Devices & Instruments industry, Baxter International Inc (BAX, Financial) has enjoyed a stellar reputation. However, it has recently witnessed a daily loss of 0.22%, juxtaposed with a three-month change of 11.95%. Fresh insights from the GF Score hint at potential headwinds. Notably, its diminished rankings in financial strength, growth, and valuation suggest that the company might not live up to its historical performance. Join us as we dive deep into these pivotal metrics to unravel the evolving narrative of Baxter International Inc.
What Is the GF Score?
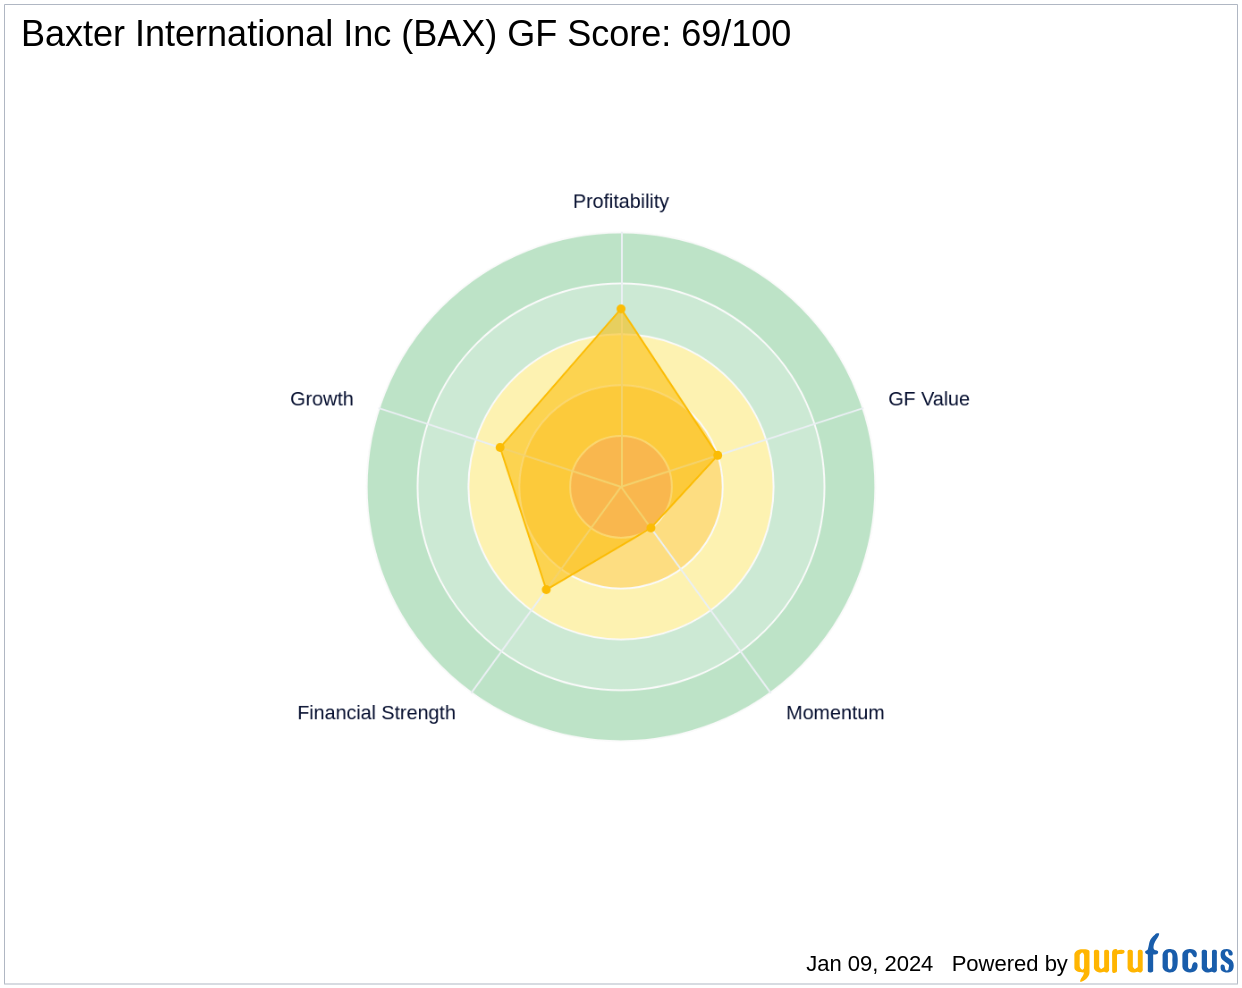
The GF Score is a stock performance ranking system developed by GuruFocus using five aspects of valuation, which has been found to be closely correlated to the long-term performances of stocks by backtesting from 2006 to 2021. The stocks with a higher GF Score generally generate higher returns than those with a lower GF Score. Therefore, when picking stocks, investors should invest in companies with high GF Scores. The GF Score ranges from 0 to 100, with 100 as the highest rank.
- Financial strength rank: 5/10
- Profitability rank: 7/10
- Growth rank: 5/10
- GF Value rank: 4/10
- Momentum rank: 2/10
Based on the above method, GuruFocus assigned Baxter International Inc a GF Score of 69 out of 100, which signals poor future outperformance potential.
Understanding Baxter International Inc's Business
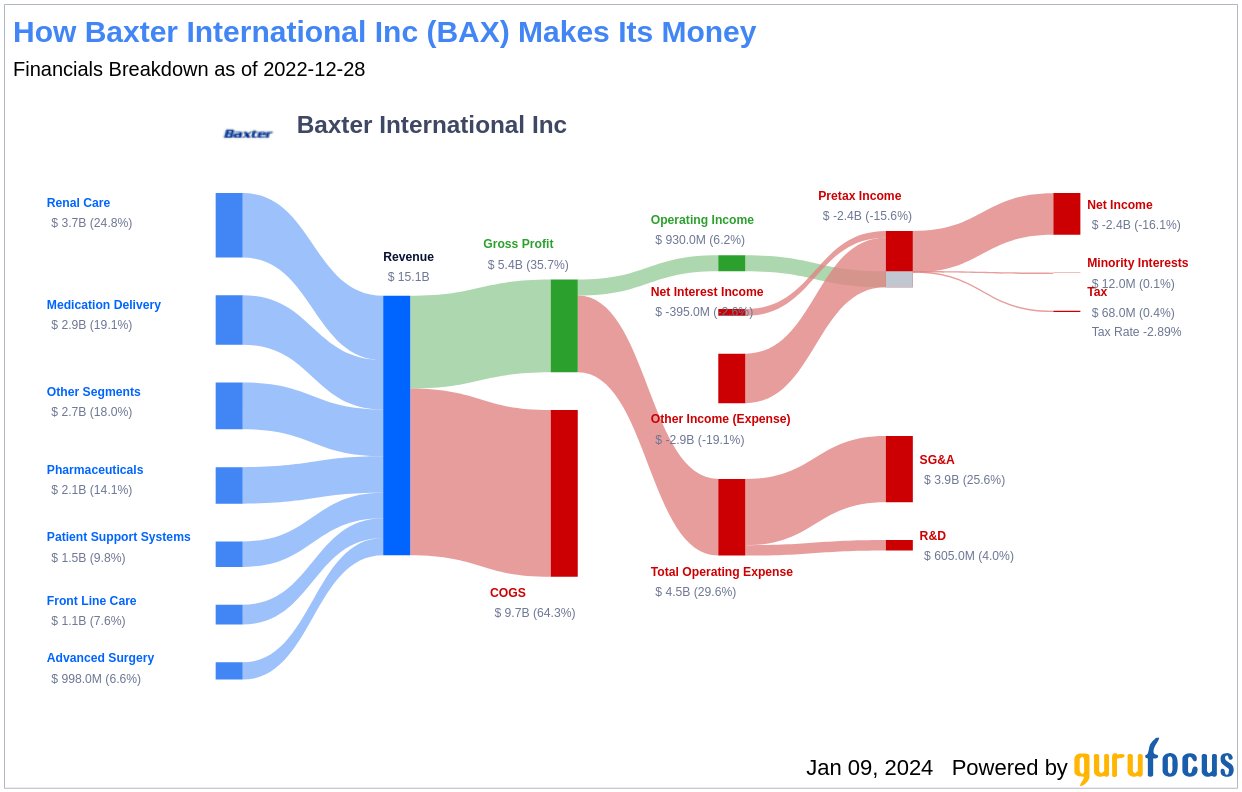
Baxter International Inc, with a market cap of $20.59 billion and sales of $15.42 billion, is a key player in the medical devices and instruments sector. The company's operating margin stands at 4.94%. Baxter International Inc enhanced its portfolio of hospital-focused offerings by acquiring Hillrom in late 2021, which added basic equipment, including hospital beds, to the portfolio, although about half of Hillrom's revenue comes from more digitally connected offerings like its smart beds and Voalte medical communications app. From its legacy operations, Baxter offers tools to help patients with acute and chronic kidney failure, which it plans to spin off by mid-2024. It also sells a variety of injectable therapies for use in care settings, such as IV pumps, administrative sets, and solutions; nutritional products; and surgical sealants and hemostatic agents.
Financial Strength Breakdown
Baxter International Inc's financial strength indicators present some concerning insights about the company's balance sheet health. The interest coverage ratio of 1.47 positions it worse than 93.3% of 418 companies in the Medical Devices & Instruments industry. This ratio highlights potential challenges the company might face when handling its interest expenses on outstanding debt. The esteemed investor Benjamin Graham typically favored companies with an interest coverage ratio of at least five.
The company's Altman Z-Score is just 2.09, which is below the safe threshold of 2.99. Although this does not imply immediate danger of financial distress, the stock may face some financial struggles if the Altman Z-score drops below 1.81. Furthermore, the company's low cash-to-debt ratio at 0.34 indicates a struggle in handling existing debt levels. The company's debt-to-equity ratio is 2.09, which is worse than 96.87% of 702 companies in the Medical Devices & Instruments industry, suggesting over-reliance on borrowing and vulnerability to market fluctuations. Additionally, the company's debt-to-Ebitda ratio is 8.54, which is above Joel Tillinghast's warning level of 4 and is worse than 92.81% of 431 companies in the Medical Devices & Instruments industry.
Next Steps
Considering Baxter International Inc's financial strength, profitability, and growth metrics, the GF Score highlights the firm's unparalleled position for potential underperformance. With a GF Score of 69, the company's future prospects in terms of stock performance seem to be challenged by its financial leverage and market momentum. Value investors may need to exercise caution and conduct further analysis before considering an investment in Baxter International Inc.
GuruFocus Premium members can find more companies with strong GF Scores using the following screener link: GF Score Screen
This article, generated by GuruFocus, is designed to provide general insights and is not tailored financial advice. Our commentary is rooted in historical data and analyst projections, utilizing an impartial methodology, and is not intended to serve as specific investment guidance. It does not formulate a recommendation to purchase or divest any stock and does not consider individual investment objectives or financial circumstances. Our objective is to deliver long-term, fundamental data-driven analysis. Be aware that our analysis might not incorporate the most recent, price-sensitive company announcements or qualitative information. GuruFocus holds no position in the stocks mentioned herein.