

Overvalued, overbought, overbullish. When in history have we seen the Shiller P/E (S&P 500 divided by the 10-year average of inflation-adjusted earnings) above 23, the S&P 500 over 60% above its 4-year low and 10% above its 52-week average, with investment advisory bears below 20% for at least two weeks running? Three times: the April 2010 peak, the March-May 2011 peak – both followed by corrections approaching 20% – and today. Even if one ignores the historical evidence suggesting the potential for significant bear market losses over the next couple of years, speculators should be aware that present conditions have been hostile even in the context of the recent bull market advance.
I use the word “speculators” intentionally, as the historical evidence overwhelmingly indicates that there is little in the way of “investment” merit at present valuations. See Investment, Speculation, Valuation, and Tinker Bell for a review of the simplistic “forward earnings” measures universally touted by Wall Street here, compared with a range of distinct valuation approaches (including a far more effective use of forward earnings), all which reach nearly identical conclusions, and all which have a dramatically stronger relationship with subsequent market returns at every horizon. Our present estimate of prospective 10-year S&P 500 nominal total returns is now down to about 3.5% annually.
...
So purely for exposition (again, this isn’t our working definition in practice), we’ll define overvalued, overbought, overbullish, rising-yield conditions as follows: Overvalued – Shiller P/E of 18; Overbought – S&P 500 at least 9% above its 12 month average, 50% above its 4-yr low, and at a 4 year high; Overbullish – Investors Intelligence bearish sentiment below 26%; Rising yields – 10-year Treasury yield higher than 6 months earlier. The historical points corresponding to these criteria are identified by the blue lines, with the S&P 500 Index (log scale) in red. Note that this particular set of criteria became active about 4 weeks ago, at about 1550 on the Index.
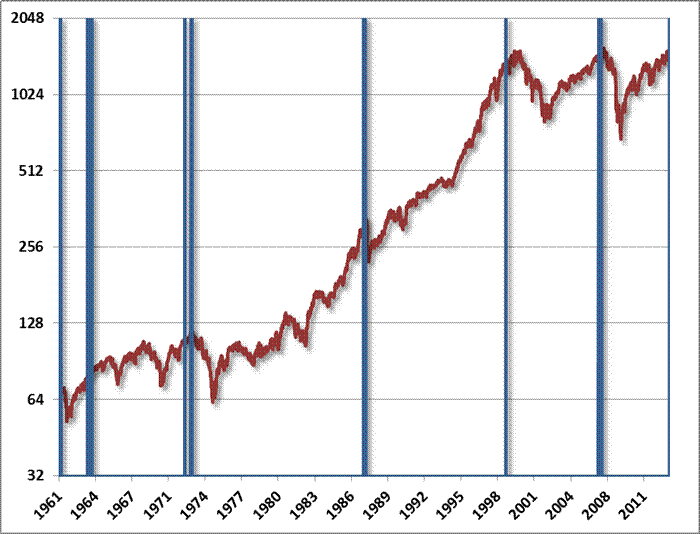
On a long-term chart like this, it’s easy to see that each instance – even 1964 – was ultimately followed by substantially lower market levels, and better investment opportunities for investors having a full-cycle investment perspective. What I want to emphasize here is how difficult investors would have found it to maintain a defensive discipline in real-time.
Notice that this set of criteria indicated an overvalued, overbought, overbullish, rising-yield condition in March 1964, at a level of about 80 on the S&P 500. Yet the S&P 500 advanced to 90 by May 1965, experienced a brief correction of less than 10%, and then advanced to 94 by February 1966, gaining about 20% over that two-year period. Put yourself in the shoes of investors at that optimistic market peak. Remember that they were yet to watch the S&P 500 quickly lose all of those gains, and then some, in the 1966 bear market, and would go on to discover that stocks would underperform Treasury bills for another 16 years.
Read the complete commentary
Also check out:
I use the word “speculators” intentionally, as the historical evidence overwhelmingly indicates that there is little in the way of “investment” merit at present valuations. See Investment, Speculation, Valuation, and Tinker Bell for a review of the simplistic “forward earnings” measures universally touted by Wall Street here, compared with a range of distinct valuation approaches (including a far more effective use of forward earnings), all which reach nearly identical conclusions, and all which have a dramatically stronger relationship with subsequent market returns at every horizon. Our present estimate of prospective 10-year S&P 500 nominal total returns is now down to about 3.5% annually.
...
So purely for exposition (again, this isn’t our working definition in practice), we’ll define overvalued, overbought, overbullish, rising-yield conditions as follows: Overvalued – Shiller P/E of 18; Overbought – S&P 500 at least 9% above its 12 month average, 50% above its 4-yr low, and at a 4 year high; Overbullish – Investors Intelligence bearish sentiment below 26%; Rising yields – 10-year Treasury yield higher than 6 months earlier. The historical points corresponding to these criteria are identified by the blue lines, with the S&P 500 Index (log scale) in red. Note that this particular set of criteria became active about 4 weeks ago, at about 1550 on the Index.
On a long-term chart like this, it’s easy to see that each instance – even 1964 – was ultimately followed by substantially lower market levels, and better investment opportunities for investors having a full-cycle investment perspective. What I want to emphasize here is how difficult investors would have found it to maintain a defensive discipline in real-time.
Notice that this set of criteria indicated an overvalued, overbought, overbullish, rising-yield condition in March 1964, at a level of about 80 on the S&P 500. Yet the S&P 500 advanced to 90 by May 1965, experienced a brief correction of less than 10%, and then advanced to 94 by February 1966, gaining about 20% over that two-year period. Put yourself in the shoes of investors at that optimistic market peak. Remember that they were yet to watch the S&P 500 quickly lose all of those gains, and then some, in the 1966 bear market, and would go on to discover that stocks would underperform Treasury bills for another 16 years.
Read the complete commentary
Also check out: