

Assessing the Upcoming Dividend Payment and Historical Performance
Wells Fargo & Co (WFC, Financial) recently announced a dividend of $0.35 per share, payable on 2024-03-01, with the ex-dividend date set for 2024-02-01. As investors look forward to this upcoming payment, the spotlight also shines on the company's dividend history, yield, and growth rates. Using the data from GuruFocus, let's look into Wells Fargo & Co's dividend performance and assess its sustainability.
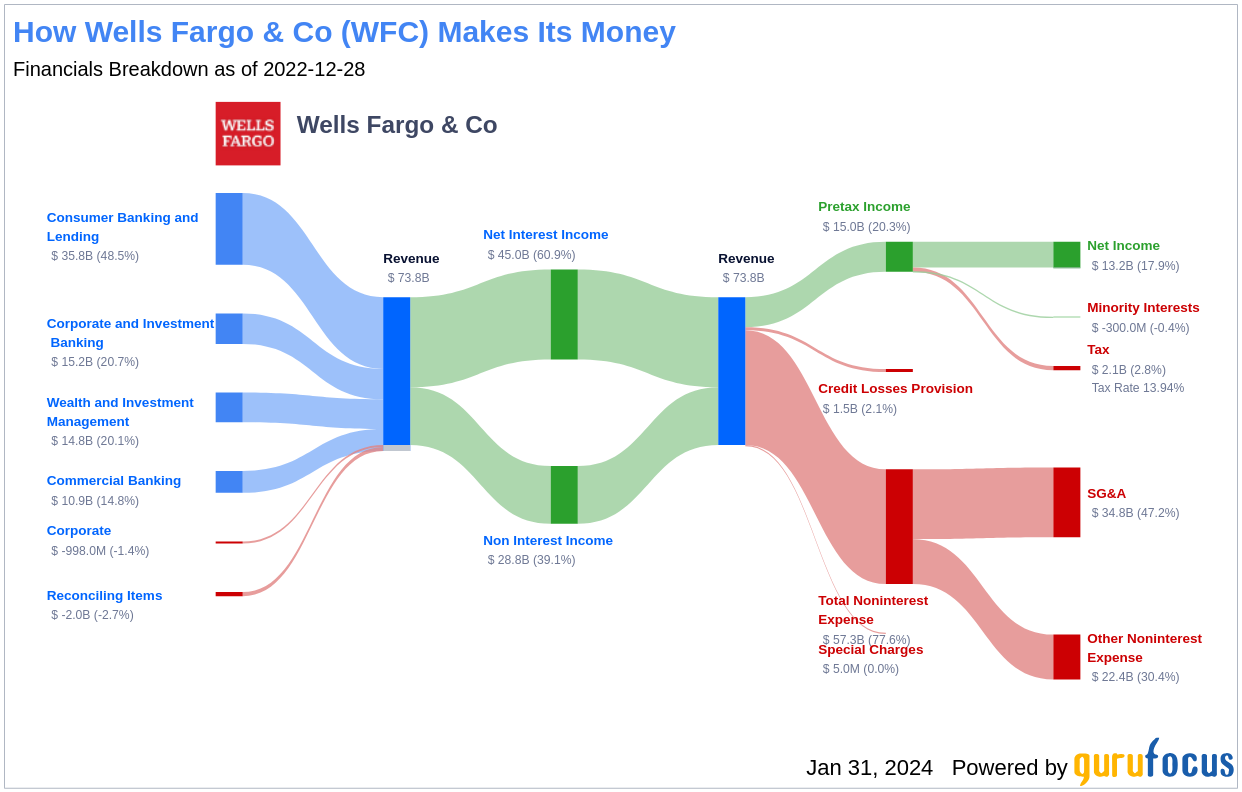
What Does Wells Fargo & Co Do?
Wells Fargo & Co (WFC, Financial) is one of the largest banks in the United States, with approximately $1.9 trillion in balance sheet assets. The company operates through four primary segments: consumer banking, commercial banking, corporate and investment banking, and wealth and investment management. With a focus largely on the U.S. market, Wells Fargo & Co provides a range of financial services to millions of customers nationwide.
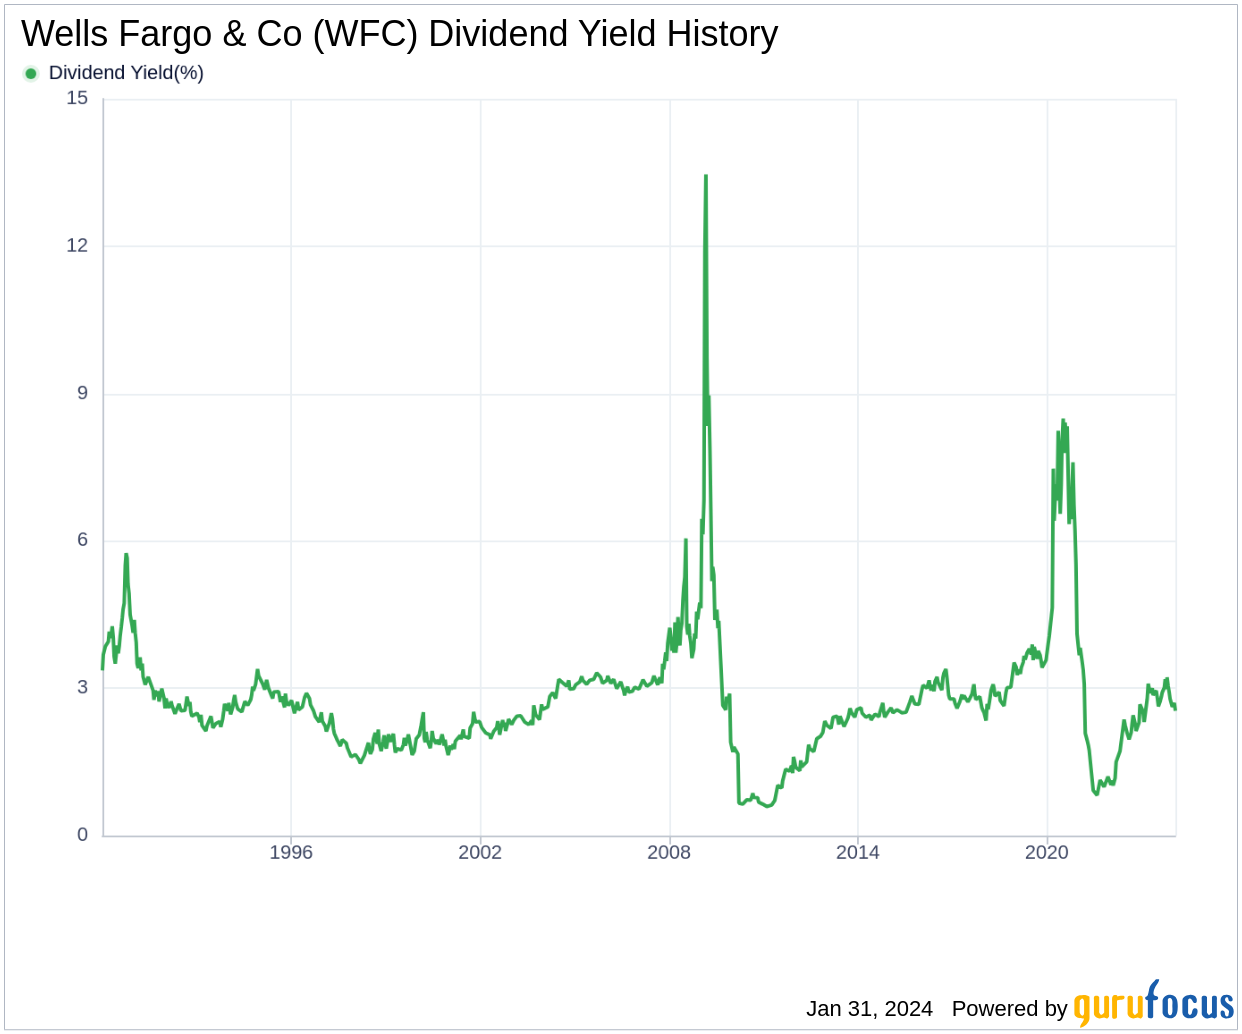
A Glimpse at Wells Fargo & Co's Dividend History
Wells Fargo & Co has a long-standing reputation for providing consistent dividend payments, with a record dating back to 1986. The company pays dividends on a quarterly basis, offering investors a steady income stream. Below is a chart showing the annual Dividends Per Share to track historical trends.
Breaking Down Wells Fargo & Co's Dividend Yield and Growth
As of today, Wells Fargo & Co boasts a 12-month trailing dividend yield of 2.56% and a 12-month forward dividend yield of 2.75%. This forward-looking metric indicates an anticipated increase in dividend payments over the next year.
However, the company's recent dividend growth rates present a mixed picture. Over the past three years, the annual dividend growth rate was -16.90%, extending to -13.70% over a five-year period. The ten-year annual dividends per share growth rate is a modest -0.50%. Consequently, the 5-year yield on cost for Wells Fargo & Co stock is approximately 1.23% as of today.
The Sustainability Question: Payout Ratio and Profitability
The dividend payout ratio is a critical metric for assessing dividend sustainability. Wells Fargo & Co's ratio of 0.27 as of 2023-12-31 indicates that the company retains a substantial portion of its earnings, which can be used for future growth or as a cushion during downturns.
Additionally, Wells Fargo & Co's profitability rank of 6 out of 10 reflects fair profitability. The company's consistent positive net income over the past decade underlines its financial health and supports its dividend payments.
Growth Metrics: The Future Outlook
Wells Fargo & Co's growth rank of 6 out of 10 indicates a fair growth outlook, which is essential for maintaining dividend payments. While the company's revenue per share and 3-year revenue growth rate suggest a solid revenue model, the growth rate of -0.70% per year is less impressive when compared to global peers.
The company's 3-year EPS growth rate and 5-year EBITDA growth rate also lag behind many competitors, which could raise concerns about sustaining long-term dividend growth.
Next Steps
In conclusion, while Wells Fargo & Co's dividend payment is anticipated to increase, the company's dividend growth rate, payout ratio, profitability, and growth metrics present a complex picture. The negative growth rates in dividends and earnings are areas of concern, though the company's strong profitability and conservative payout ratio may provide some assurance to dividend-seeking investors. As Wells Fargo & Co navigates the challenges ahead, investors should closely monitor these metrics to gauge the future direction of dividend payments.
For those interested in high-dividend yield opportunities, GuruFocus Premium users can utilize the High Dividend Yield Screener to discover stocks that meet their investment criteria.
This article, generated by GuruFocus, is designed to provide general insights and is not tailored financial advice. Our commentary is rooted in historical data and analyst projections, utilizing an impartial methodology, and is not intended to serve as specific investment guidance. It does not formulate a recommendation to purchase or divest any stock and does not consider individual investment objectives or financial circumstances. Our objective is to deliver long-term, fundamental data-driven analysis. Be aware that our analysis might not incorporate the most recent, price-sensitive company announcements or qualitative information. GuruFocus holds no position in the stocks mentioned herein.