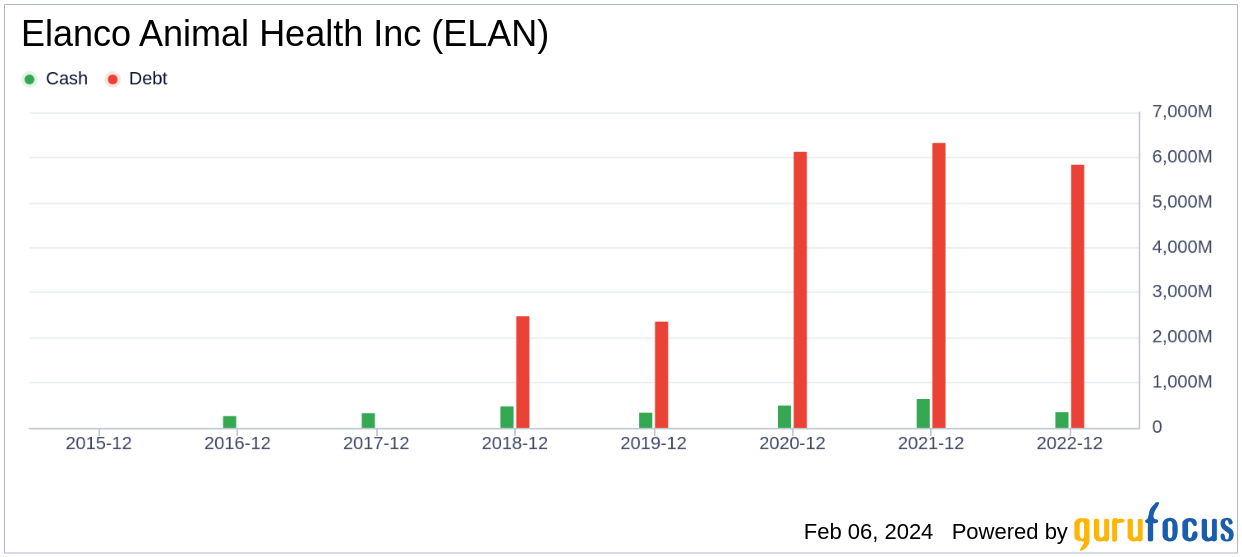
Elanco Animal Health Inc (ELAN, Financial) has experienced a remarkable surge in its stock price, with a 4.67% gain over the past week and an impressive 65.45% gain over the past three months. The company's market capitalization now stands at $7.84 billion, with a current price of $15.9 per share. According to GF Value, Elanco is currently modestly undervalued, with a GF Value of $22.19, down from a past GF Value of $24.2. This shift in valuation from a possible value trap to a more favorable investment opportunity has caught the attention of value investors.
Understanding Elanco Animal Health Inc
Elanco Animal Health Inc, operating within the drug manufacturers industry, is a global innovator and marketer of products for companion and food animals. The company's reach extends to over 90 countries, where it offers a diverse range of products for animals including cattle, sheep, goats, and swine. Elanco's commitment to animal health is reflected in its extensive product portfolio and its global operational footprint.

Profitability Insights
Elanco's Profitability Rank stands at 4/10, indicating challenges in maintaining consistent profitability. The company's operating margin is 7.81%, which is better than 55.08% of its peers. However, its ROE of -16.31% and ROA of -7.49% suggest difficulties in generating returns on equity and assets, although these figures are still better than 24.95% and 30.9% of industry peers, respectively. The ROIC of 2.32% is more encouraging, surpassing 47.89% of competitors. Despite these mixed results, Elanco has managed to remain profitable over the past two years, outperforming 13.71% of its peers.

Growth Trajectory
Elanco's Growth Rank is currently at 1/10, reflecting significant challenges in its growth trajectory. The company's 3-Year Revenue Growth Rate per Share is 2.90%, which is better than 38.55% of its peers, and its 5-Year Revenue Growth Rate per Share is 1.20%, outperforming 29.69% of competitors. However, the 3-Year EPS without NRI Growth Rate is -39.60%, which, while better than 9.04% of peers, indicates a concerning decline in earnings per share over the past three years.

Investor Confidence
Major holders of Elanco stock demonstrate significant confidence in the company's potential. Dodge & Cox is the leading holder with 84,203,300 shares, representing a 17.09% share percentage. PRIMECAP Management (Trades, Portfolio) follows with 49,168,659 shares, accounting for 9.98% of shares. Steven Cohen (Trades, Portfolio) also holds a stake in Elanco, with 3,599,461 shares, equating to 0.73% of the company. These substantial investments by prominent investors signal a strong belief in Elanco's future prospects.
Competitive Landscape
When compared to its competitors, Elanco holds a strong market position. Intra-Cellular Therapies Inc (ITCI, Financial) has a market cap of $6.64 billion, Lantheus Holdings Inc (LNTH, Financial) is valued at $3.7 billion, and Alkermes PLC (ALKS, Financial) stands at $4.41 billion. Elanco's market cap of $7.84 billion not only surpasses these competitors but also reflects its significant presence in the animal health industry.
Conclusion
Elanco Animal Health Inc's recent stock performance has been noteworthy, with a substantial 65.45% gain over the past three months. The company's current valuation status, as indicated by the GF Value, suggests that it is modestly undervalued, presenting a potential opportunity for investors. While profitability metrics show room for improvement, the company's operational efficiency and investor confidence, as evidenced by the stakes of major holders, are positive signs. In comparison to its industry peers, Elanco's market position is robust, further solidifying its appeal to value investors seeking growth potential in the drug manufacturing sector.
This article, generated by GuruFocus, is designed to provide general insights and is not tailored financial advice. Our commentary is rooted in historical data and analyst projections, utilizing an impartial methodology, and is not intended to serve as specific investment guidance. It does not formulate a recommendation to purchase or divest any stock and does not consider individual investment objectives or financial circumstances. Our objective is to deliver long-term, fundamental data-driven analysis. Be aware that our analysis might not incorporate the most recent, price-sensitive company announcements or qualitative information. GuruFocus holds no position in the stocks mentioned herein.