

On overvalued, overbought, overbullish conditions
Last week, Investors Intelligence reported that the percentage of bullish investment advisors moved to 54.2% (from 52.1% the prior week) with just 19.8% of advisors bearish. The Shiller P/E (S&P 500 Index divided by the 10-year average of inflation-adjusted earnings) reached 24.5. The S&P 500 is well-through its upper Bollinger bands (two standard deviations above its 20 period moving average) on weekly and monthly resolutions, in a mature bull market advance, with 10-year Treasury yields higher than they were 6-months prior.
None of these conditions in isolation has enormous impact; each usually only modifies expected returns. The problem is that when significantly overvalued, overbought, overbullish conditions have been observed together – particularly coupled with rising bond yields – the syndrome indicates a disease that none of the symptoms identify individually.
I’ve noted before that even a Shiller P/E above 18 combined with a wide spread of bulls versus bears at some point during the prior 4-week period is generally enough to outweigh trend-following considerations, such as the S&P 500 being above its 200-day moving average (see Aligning Market Exposure with the Expected Return/Risk Profile). I’ve also noted that some conditions can be more simply defined. For example, instances featuring bearish advisors below 20%, with the S&P 500 at a 4-year high and a Shiller P/E above 18 are limited to the present advance, May 2007, August 1987, December 1972 (though with an early signal in March-May of that year), and February 1966, all which were followed by significant bear market losses.
Various definitions of an overvalued, overbought, overbullish syndrome can capture slightly different instances. Less stringent definitions capture a larger number of danger zones, but also allow more false signals. Still, as long as the basic syndrome is captured, the subsequent market outcomes are almost invariably negative, on average. Presently, what we observe is among the least frequent and most hostile syndromes we identify. As I observed in the weekly comment that turned out, in hindsight, to accompany the 2007 market peak (see Warning – Examine All Risk Exposures):
“There is one particular syndrome of conditions after which stocks have reliably suffered major, generally abrupt losses, without any historical counter-examples. This syndrome features a combination of overvalued, overbought, overbullish conditions in an environment of upward pressure on yields or risk spreads. The negative outcomes are robust to alternative definitions, provided that they capture that general syndrome.”
The chart below highlights each point in history that we’ve observed the following conditions: Overvalued: Shiller P/E anywhere above 18; Overbought: S&P 500 at least 7% above its 12-month average, within 3% of its upper Bollinger bands on weekly and monthly resolutions, and to capture a mature advance, the S&P 500 well over 50% above its lowest point in the prior 4 years; Overbullish: a two-week average of advisory bulls more than 52%, and advisory bears less than 28%. Rising yields: 10-year Treasury yields higher than 6-months earlier. The instance in 1929 is based on imputed sentiment data, as bullish and bearish sentiment is correlated with the extent and volatility of prior market fluctuations.
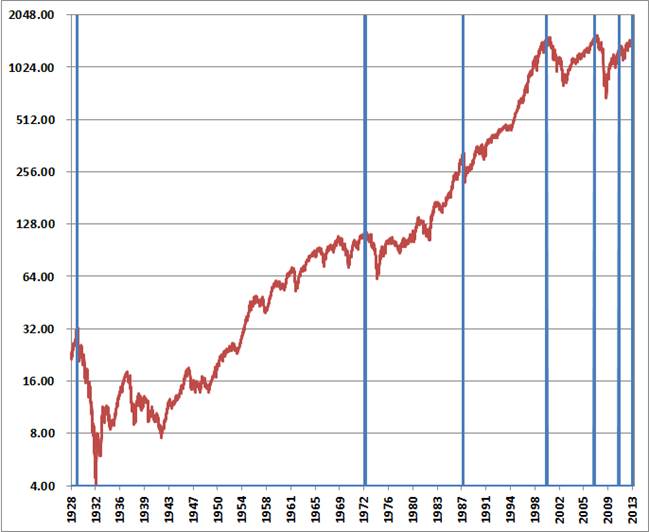
One of the difficulties with this sort of analysis is that instances that appear to be very clear peaks on an 85-year chart are actually periods where there was often a cluster of instances with further market advances for several more weeks. In 1929, the market advanced another 5% to its final peak in the two weeks following the first instance of this syndrome. In 1972, the market advanced a final 3% over 6 weeks. The 1987 and 2000 peaks occurred the same week that the syndrome emerged. In 2007, the S&P 500 advanced to within 2% of its final peak 3 weeks after this syndrome emerged, and crawled within 1% of that peak after 9 weeks. The S&P 500 then dropped nearly 10% over the next 4 weeks, and then staged a final 11% spike over 8 weeks to a marginal new high which actually marked the 2007 peak. In 2011 the market enjoyed a choppy 6% advance, dragged out over 16 weeks, before rolling into a 19% correction over the following 12 weeks. The present signal reiterates the first one that we observed in late-January, 17 weeks ago. To a long-term investor, this is the blink of an eye, but in the context of day after day of bullish euphoria, it seems like an absolute eternity.
In general, the initial decline from these peaks tends to occur as a sharp 6-10% market drop over a handful of weeks, typically followed by a partial recovery attempt toward the prior peak. This sort of activity both before and after major peaks gives the market the impression of near-term “resilience” that dilutes the resolve even of investors who know the history of these things.
I should note that present conditions are extreme enough that neither trend-following nor momentum factors can be used to separate out favorable outcomes from this small set of decidedly unfavorable ones. As I’ve previously noted, a great deal of our research during this advance has focused on this sort of “exclusion analysis.” I recognize that many investors have simply decided on the strategy of holding stocks until QE ends, or some similar formulation of “strategy,” but for better or worse, we do insist on approaches that we can validate in historical and out-of-sample data, and that have been strongly effective over full market cycles. When we examine the past few years, as well as long-term history, the most effective “exclusions” aren’t simple ones like “don’t fight the trend” or “don’t fight the Fed.” Rather, they are more subtle prescriptions like “stay with the trend in an overvalued market, but only until overvalued, overbought, overbullish conditions are established.” These considerations aren’t actually required to do well over complete market cycles, but quantitative easing has held off the resolution of historically unfavorable market conditions much longer than usual, and these subtle considerations would have undoubtedly made recent experience less frustrating.
If this bull market is to continue, I have little doubt that considerations like this will provide the opportunity to be constructive on the basis of well-tested evidence that actually supports a constructive stance. Here and now, a constructive stance is an experiment about whether QE can override market conditions that have always preceded unfortunate outcomes. My views and research should be of no impediment to investors with a different view, assuming that they have a reliable exit criterion that will precede the attempts of tens of millions of others to exit. It would be far easier to conduct that experiment without me than to convince me that it is a good idea.
As the respected technician Bob Farrell once noted, “exponential rapidly rising or falling markets usually go further than you think, but they do not correct by going sideways.” This is really all the 1987 crash was – a mass of investors trying to preserve profits from the preceding advance by acting on the identical trend-following exit signal simultaneously.
On valuations
Even in the event that quantitative easing is sufficient to override hostile market conditions in the near-term, it is worth noting that long-term outcomes are likely to be unaffected. We presently estimate a prospective 10-year total return on the S&P 500 Index of just 2.9% annually (nominal). See Investment, Speculation, Valuation and Tinker Bell for the general methodology here, which has a correlation of nearly 90% with subsequent 10-year market returns – about twice the correlation and nearly four times the explanatory power as the “Fed Model” and naïve estimates of the “equity risk premium” based on forward operating earnings.
We presently estimate that the S&P 500 is about 94% above the level that would be required to achieve historically normal market returns. If you work out present discounted values, you’ll find that depressed interest rates can explain only a fraction of this differential, even assuming another decade of QE – and even then only if historically inconsistent assumptions are made to combine normal economic growth with deeply depressed rates.
This chart gives a good overview of what has actually transpired in the stock market through post-war history. Points of deep undervaluation like 1942, 1950, 1974 and 1982 created foundations on which long secular bull market advances were built. The rich valuations of the mid-1960’s were enough to ensure that any return to undervaluation would result in a long period of poor market returns. The late-1990’s bubble took valuations far above any historical valuation norm, and ensured that even a return to valuations previously considered “rich” would produce devastating returns, and we saw that in 2000-2002. The advance to the 2007 peak did not go nearly as far, but still ensured that even a return to normal valuations would produce devastating returns, and we saw that in 2007-2009.
Read the complete comment
Last week, Investors Intelligence reported that the percentage of bullish investment advisors moved to 54.2% (from 52.1% the prior week) with just 19.8% of advisors bearish. The Shiller P/E (S&P 500 Index divided by the 10-year average of inflation-adjusted earnings) reached 24.5. The S&P 500 is well-through its upper Bollinger bands (two standard deviations above its 20 period moving average) on weekly and monthly resolutions, in a mature bull market advance, with 10-year Treasury yields higher than they were 6-months prior.
None of these conditions in isolation has enormous impact; each usually only modifies expected returns. The problem is that when significantly overvalued, overbought, overbullish conditions have been observed together – particularly coupled with rising bond yields – the syndrome indicates a disease that none of the symptoms identify individually.
I’ve noted before that even a Shiller P/E above 18 combined with a wide spread of bulls versus bears at some point during the prior 4-week period is generally enough to outweigh trend-following considerations, such as the S&P 500 being above its 200-day moving average (see Aligning Market Exposure with the Expected Return/Risk Profile). I’ve also noted that some conditions can be more simply defined. For example, instances featuring bearish advisors below 20%, with the S&P 500 at a 4-year high and a Shiller P/E above 18 are limited to the present advance, May 2007, August 1987, December 1972 (though with an early signal in March-May of that year), and February 1966, all which were followed by significant bear market losses.
Various definitions of an overvalued, overbought, overbullish syndrome can capture slightly different instances. Less stringent definitions capture a larger number of danger zones, but also allow more false signals. Still, as long as the basic syndrome is captured, the subsequent market outcomes are almost invariably negative, on average. Presently, what we observe is among the least frequent and most hostile syndromes we identify. As I observed in the weekly comment that turned out, in hindsight, to accompany the 2007 market peak (see Warning – Examine All Risk Exposures):
“There is one particular syndrome of conditions after which stocks have reliably suffered major, generally abrupt losses, without any historical counter-examples. This syndrome features a combination of overvalued, overbought, overbullish conditions in an environment of upward pressure on yields or risk spreads. The negative outcomes are robust to alternative definitions, provided that they capture that general syndrome.”
The chart below highlights each point in history that we’ve observed the following conditions: Overvalued: Shiller P/E anywhere above 18; Overbought: S&P 500 at least 7% above its 12-month average, within 3% of its upper Bollinger bands on weekly and monthly resolutions, and to capture a mature advance, the S&P 500 well over 50% above its lowest point in the prior 4 years; Overbullish: a two-week average of advisory bulls more than 52%, and advisory bears less than 28%. Rising yields: 10-year Treasury yields higher than 6-months earlier. The instance in 1929 is based on imputed sentiment data, as bullish and bearish sentiment is correlated with the extent and volatility of prior market fluctuations.
One of the difficulties with this sort of analysis is that instances that appear to be very clear peaks on an 85-year chart are actually periods where there was often a cluster of instances with further market advances for several more weeks. In 1929, the market advanced another 5% to its final peak in the two weeks following the first instance of this syndrome. In 1972, the market advanced a final 3% over 6 weeks. The 1987 and 2000 peaks occurred the same week that the syndrome emerged. In 2007, the S&P 500 advanced to within 2% of its final peak 3 weeks after this syndrome emerged, and crawled within 1% of that peak after 9 weeks. The S&P 500 then dropped nearly 10% over the next 4 weeks, and then staged a final 11% spike over 8 weeks to a marginal new high which actually marked the 2007 peak. In 2011 the market enjoyed a choppy 6% advance, dragged out over 16 weeks, before rolling into a 19% correction over the following 12 weeks. The present signal reiterates the first one that we observed in late-January, 17 weeks ago. To a long-term investor, this is the blink of an eye, but in the context of day after day of bullish euphoria, it seems like an absolute eternity.
In general, the initial decline from these peaks tends to occur as a sharp 6-10% market drop over a handful of weeks, typically followed by a partial recovery attempt toward the prior peak. This sort of activity both before and after major peaks gives the market the impression of near-term “resilience” that dilutes the resolve even of investors who know the history of these things.
I should note that present conditions are extreme enough that neither trend-following nor momentum factors can be used to separate out favorable outcomes from this small set of decidedly unfavorable ones. As I’ve previously noted, a great deal of our research during this advance has focused on this sort of “exclusion analysis.” I recognize that many investors have simply decided on the strategy of holding stocks until QE ends, or some similar formulation of “strategy,” but for better or worse, we do insist on approaches that we can validate in historical and out-of-sample data, and that have been strongly effective over full market cycles. When we examine the past few years, as well as long-term history, the most effective “exclusions” aren’t simple ones like “don’t fight the trend” or “don’t fight the Fed.” Rather, they are more subtle prescriptions like “stay with the trend in an overvalued market, but only until overvalued, overbought, overbullish conditions are established.” These considerations aren’t actually required to do well over complete market cycles, but quantitative easing has held off the resolution of historically unfavorable market conditions much longer than usual, and these subtle considerations would have undoubtedly made recent experience less frustrating.
If this bull market is to continue, I have little doubt that considerations like this will provide the opportunity to be constructive on the basis of well-tested evidence that actually supports a constructive stance. Here and now, a constructive stance is an experiment about whether QE can override market conditions that have always preceded unfortunate outcomes. My views and research should be of no impediment to investors with a different view, assuming that they have a reliable exit criterion that will precede the attempts of tens of millions of others to exit. It would be far easier to conduct that experiment without me than to convince me that it is a good idea.
As the respected technician Bob Farrell once noted, “exponential rapidly rising or falling markets usually go further than you think, but they do not correct by going sideways.” This is really all the 1987 crash was – a mass of investors trying to preserve profits from the preceding advance by acting on the identical trend-following exit signal simultaneously.
On valuations
Even in the event that quantitative easing is sufficient to override hostile market conditions in the near-term, it is worth noting that long-term outcomes are likely to be unaffected. We presently estimate a prospective 10-year total return on the S&P 500 Index of just 2.9% annually (nominal). See Investment, Speculation, Valuation and Tinker Bell for the general methodology here, which has a correlation of nearly 90% with subsequent 10-year market returns – about twice the correlation and nearly four times the explanatory power as the “Fed Model” and naïve estimates of the “equity risk premium” based on forward operating earnings.
We presently estimate that the S&P 500 is about 94% above the level that would be required to achieve historically normal market returns. If you work out present discounted values, you’ll find that depressed interest rates can explain only a fraction of this differential, even assuming another decade of QE – and even then only if historically inconsistent assumptions are made to combine normal economic growth with deeply depressed rates.
This chart gives a good overview of what has actually transpired in the stock market through post-war history. Points of deep undervaluation like 1942, 1950, 1974 and 1982 created foundations on which long secular bull market advances were built. The rich valuations of the mid-1960’s were enough to ensure that any return to undervaluation would result in a long period of poor market returns. The late-1990’s bubble took valuations far above any historical valuation norm, and ensured that even a return to valuations previously considered “rich” would produce devastating returns, and we saw that in 2000-2002. The advance to the 2007 peak did not go nearly as far, but still ensured that even a return to normal valuations would produce devastating returns, and we saw that in 2007-2009.
Read the complete comment