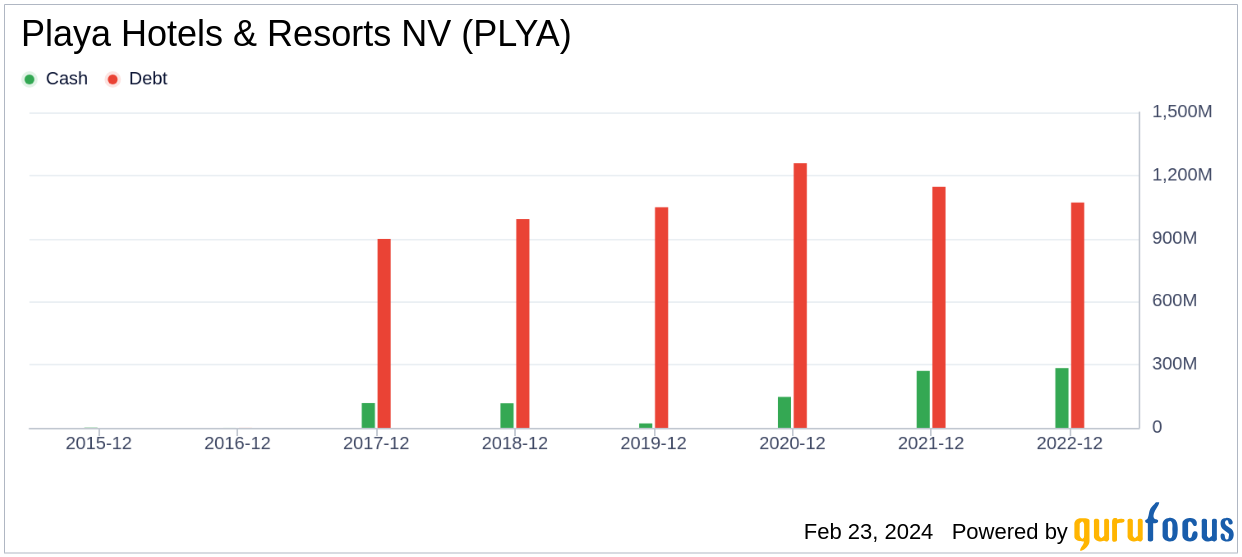
Playa Hotels & Resorts NV (PLYA, Financial) has experienced a notable uptick in its stock performance, with a 13.00% increase over the past three months. Despite a slight dip of 0.06% over the past week, the company's market capitalization stands strong at $1.29 billion, and the current stock price is $9.29. When compared to the GF Value of $12.54, up from the past GF Value of $11.68, Playa Hotels & Resorts NV is currently considered modestly undervalued. This is a positive shift from the previous valuation of a possible value trap, suggesting that investors should think twice before investing. This change in valuation indicates a more favorable outlook for the company's stock.
Introduction to Playa Hotels & Resorts NV
Playa Hotels & Resorts NV operates within the travel and leisure industry, focusing on the ownership, operation, and development of all-inclusive resorts. These resorts are situated in prime beachfront locations across Mexico and the Caribbean. The company's portfolio includes well-known brands such as HYATT ZIVA, HYATT ZILARA, Hilton, and JEWEL RESORTS, with the majority of its revenue stemming from the Yucatan Peninsula segment. The strategic positioning of Playa Hotels & Resorts NV in popular vacation destinations positions the company to capitalize on the growing travel and leisure market.

Assessing Profitability
Playa Hotels & Resorts NV's Profitability Rank is currently at 5/10, indicating a moderate level of profitability. The company's Operating Margin is 16.01%, which is commendable, outperforming 73.54% of 824 companies in the industry. Additionally, the ROE stands at 5.82%, surpassing 52.52% of its peers. The ROA at 1.88% and ROIC at 9.95% also demonstrate the company's ability to generate profits relative to its assets and invested capital, respectively. Over the past decade, Playa Hotels & Resorts NV has maintained profitability for three years, which, while modest, indicates potential for future growth.

Evaluating Growth Prospects
The company's Growth Rank is an impressive 7/10, reflecting its potential for future expansion. The 3-Year Revenue Growth Rate per Share is 1.70%, which is better than 54.83% of 766 companies in the same industry. However, the 5-Year Revenue Growth Rate per Share shows a decline of 7.50%. Despite this, the estimated Total Revenue Growth Rate for the next 3 to 5 years is an optimistic 19.58%, suggesting a strong growth trajectory ahead. The 3-Year EPS without NRI Growth Rate is an extraordinary 405.30%, outperforming 99.43% of its competitors, indicating a robust earnings potential.

Investor Confidence
Notable investors have taken an interest in Playa Hotels & Resorts NV, with Lee Ainslie (Trades, Portfolio) holding 23,857 shares, representing a 0.02% share percentage. This investment decision by a significant holder reflects a level of confidence in the company's future performance and strategic direction.
Competitive Landscape
When compared to its competitors, Playa Hotels & Resorts NV holds its own within the travel and leisure industry. Studio City International Holdings Ltd (MSC, Financial) has a market cap of $1.3 billion, Monarch Casino & Resort Inc (MCRI, Financial) at $1.32 billion, and Golden Entertainment Inc (GDEN, Financial) at $1.04 billion. These companies, with market capitalizations close to that of Playa Hotels & Resorts NV, serve as benchmarks for performance within the sector.
Conclusion
In conclusion, Playa Hotels & Resorts NV's recent stock price rally can be attributed to its modest undervaluation, improved profitability metrics, and promising growth prospects. The company's strategic positioning in the travel and leisure industry, coupled with positive investor sentiment and a competitive stance, suggests a favorable outlook for future performance. As the company continues to navigate the dynamic market landscape, investors should monitor these key indicators to make informed decisions.
This article, generated by GuruFocus, is designed to provide general insights and is not tailored financial advice. Our commentary is rooted in historical data and analyst projections, utilizing an impartial methodology, and is not intended to serve as specific investment guidance. It does not formulate a recommendation to purchase or divest any stock and does not consider individual investment objectives or financial circumstances. Our objective is to deliver long-term, fundamental data-driven analysis. Be aware that our analysis might not incorporate the most recent, price-sensitive company announcements or qualitative information. GuruFocus holds no position in the stocks mentioned herein.