
Trane Technologies PLC (TT, Financial) has recently been in the spotlight, drawing interest from investors and financial analysts due to its robust financial stance. With shares currently priced at $284.65, Trane Technologies PLC has witnessed a daily loss of 0.06%, marked against a three-month change of 26.57%. A thorough analysis, underlined by the GF Score, suggests that Trane Technologies PLC is well-positioned for substantial growth in the near future.
What Is the GF Score?
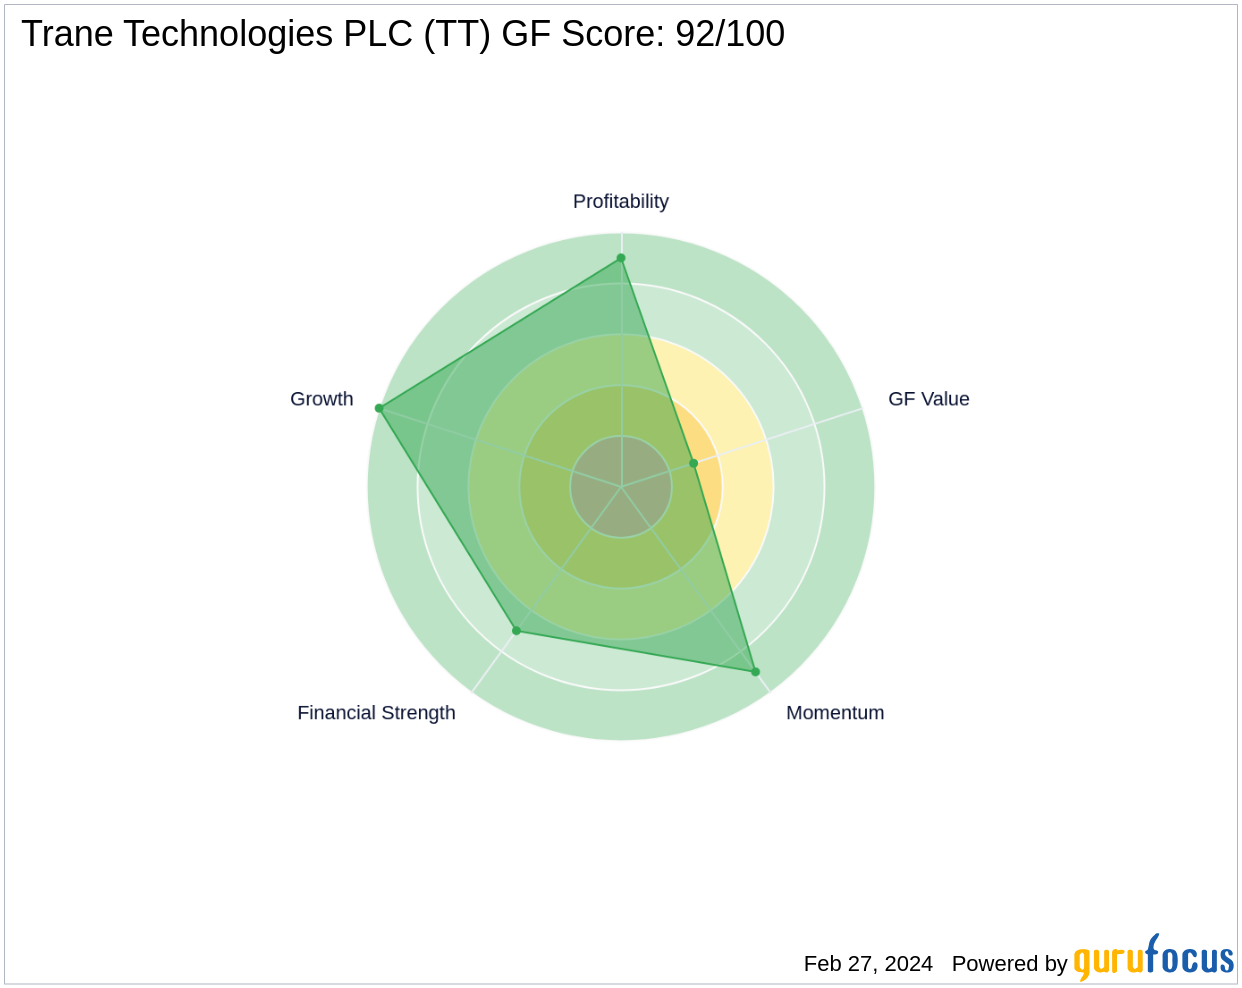
The GF Score is a stock performance ranking system developed by GuruFocus using five aspects of valuation, which has been found to be closely correlated to the long-term performances of stocks by backtesting from 2006 to 2021. The stocks with a higher GF Score generally generate higher returns than those with a lower GF Score. Therefore, when picking stocks, investors should invest in companies with high GF Scores. The GF Score ranges from 0 to 100, with 100 as the highest rank.
- Financial strength rank: 7/10
- Profitability rank: 9/10
- Growth rank: 10/10
- GF Value rank: 3/10
- Momentum rank: 9/10
With a high Growth rank and Profitability rank, Trane Technologies PLC demonstrates its capacity for expansion and efficient profit generation. Although the GF Value rank is lower, indicating the stock might be overvalued, the overall GF Score of 92 out of 100 signals the highest outperformance potential.
Understanding Trane Technologies PLC Business
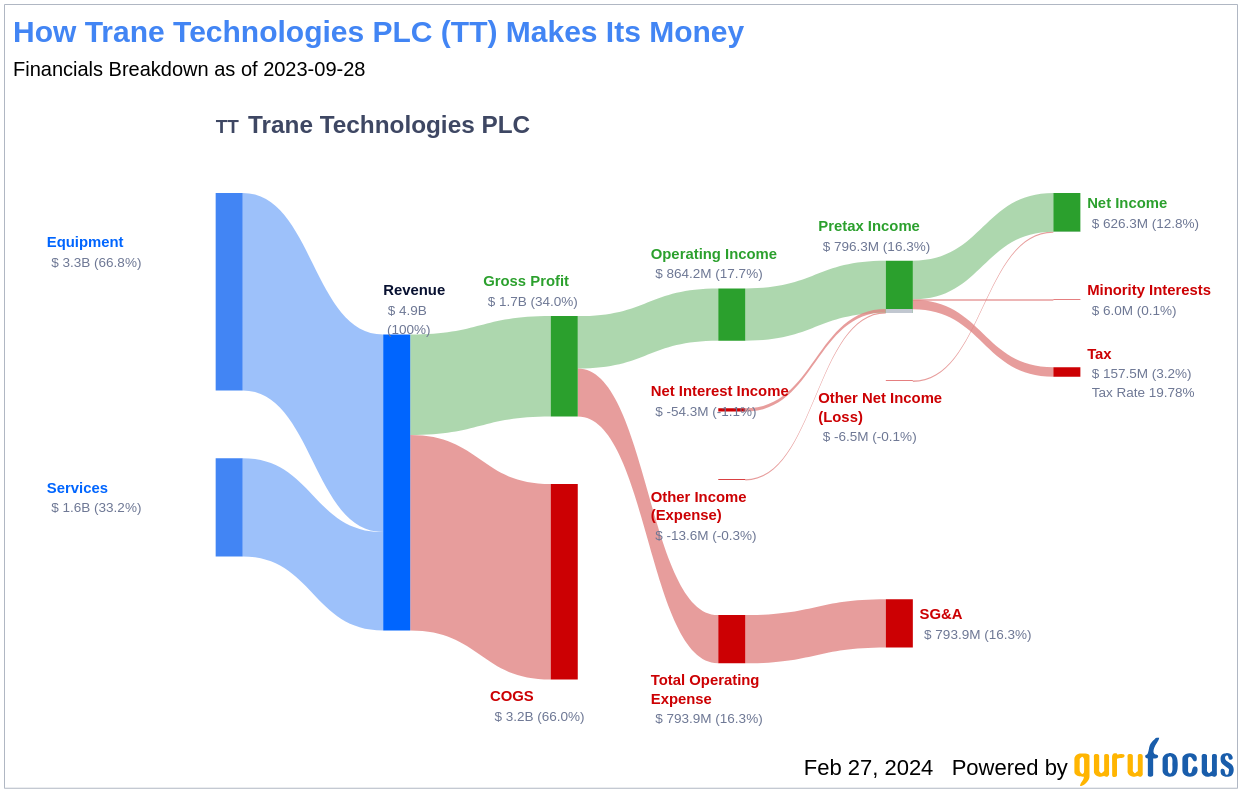
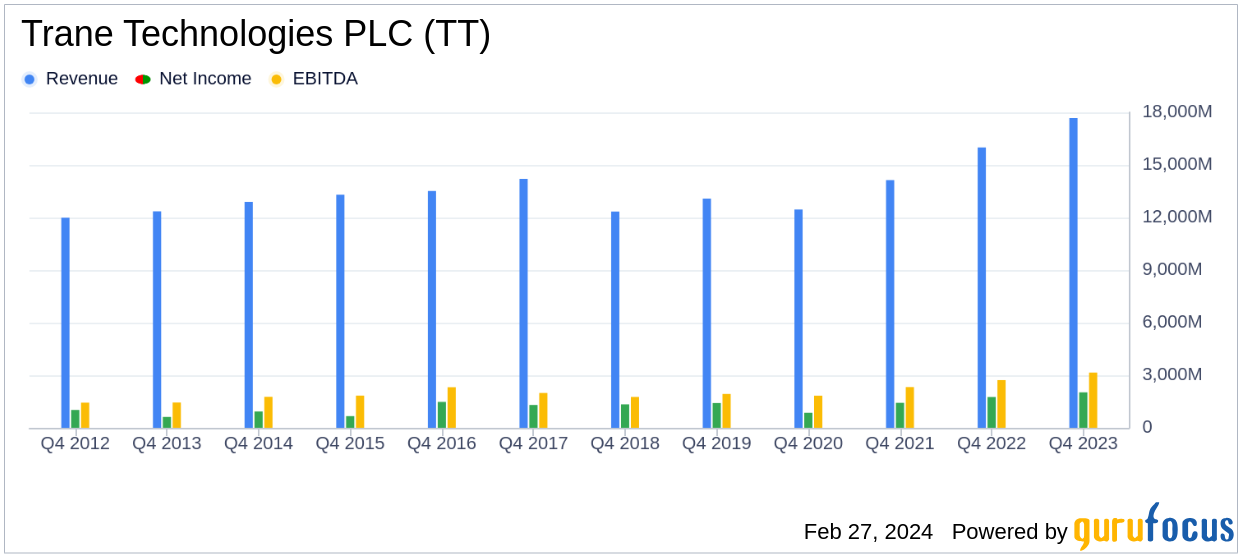
Trane Technologies PLC, with a market cap of $64.63 billion and sales of $17.68 billion, is a leading manufacturer and service provider for HVAC systems and transportation refrigeration solutions. Operating under well-known brands such as Trane, American Standard, and Thermo King, the company generates approximately 70% of its sales from equipment and 30% from parts and services. Although domiciled in Ireland, over 70% of its revenue comes from North America, reflecting its strong presence in the region.
Financial Strength Breakdown
Trane Technologies PLC's Financial Strength is evident through its impressive Interest Coverage ratio of 12.34 and an Altman Z-Score of 5.23, indicating a low probability of financial distress. The company's strategic debt management is reflected in its Debt-to-Revenue ratio of 0.27, further solidifying its financial health.
Profitability Rank Breakdown
Trane Technologies PLC's profitability is robust, with an increasing Operating Margin over the past five years, reaching 16.37% in 2023. The company's Gross Margin has also consistently risen, indicating improved efficiency in revenue conversion to profit. The Piotroski F-Score and a Predictability Rank of 3.5 stars further confirm Trane Technologies PLC's solid financial situation and consistent operational performance.
Growth Rank Breakdown
Trane Technologies PLC's high Growth rank reflects its commitment to business expansion. The company's 3-Year Revenue Growth Rate of 14.4% outperforms 78.08% of its industry peers. Additionally, its EBITDA growth rates over the past three and five years highlight its capability to sustain growth.
Next Steps
Considering Trane Technologies PLC's financial strength, profitability, and growth metrics, the GF Score highlights the firm's unparalleled position for potential outperformance. Investors seeking similar opportunities can explore more companies with strong GF Scores using the GF Score Screen.
Will Trane Technologies PLC continue to leverage its financial robustness and growth momentum to outperform the market? For value investors, the company's strong GF Score is a beacon, signaling a potentially rewarding investment horizon.
This article, generated by GuruFocus, is designed to provide general insights and is not tailored financial advice. Our commentary is rooted in historical data and analyst projections, utilizing an impartial methodology, and is not intended to serve as specific investment guidance. It does not formulate a recommendation to purchase or divest any stock and does not consider individual investment objectives or financial circumstances. Our objective is to deliver long-term, fundamental data-driven analysis. Be aware that our analysis might not incorporate the most recent, price-sensitive company announcements or qualitative information. GuruFocus holds no position in the stocks mentioned herein.