

Investors constantly seek to determine the true value of their investments, and Campbell Soup Co (CPB, Financial) is no exception. With a recent daily loss of 2.84% and a 3-month decline of 2.3%, coupled with an Earnings Per Share (EPS) of $2.56, the question arises: Is Campbell Soup Co modestly undervalued? This article aims to shed light on this query by delving into a valuation analysis of Campbell Soup Co, guiding readers through its financial landscape and intrinsic worth.
Company Introduction
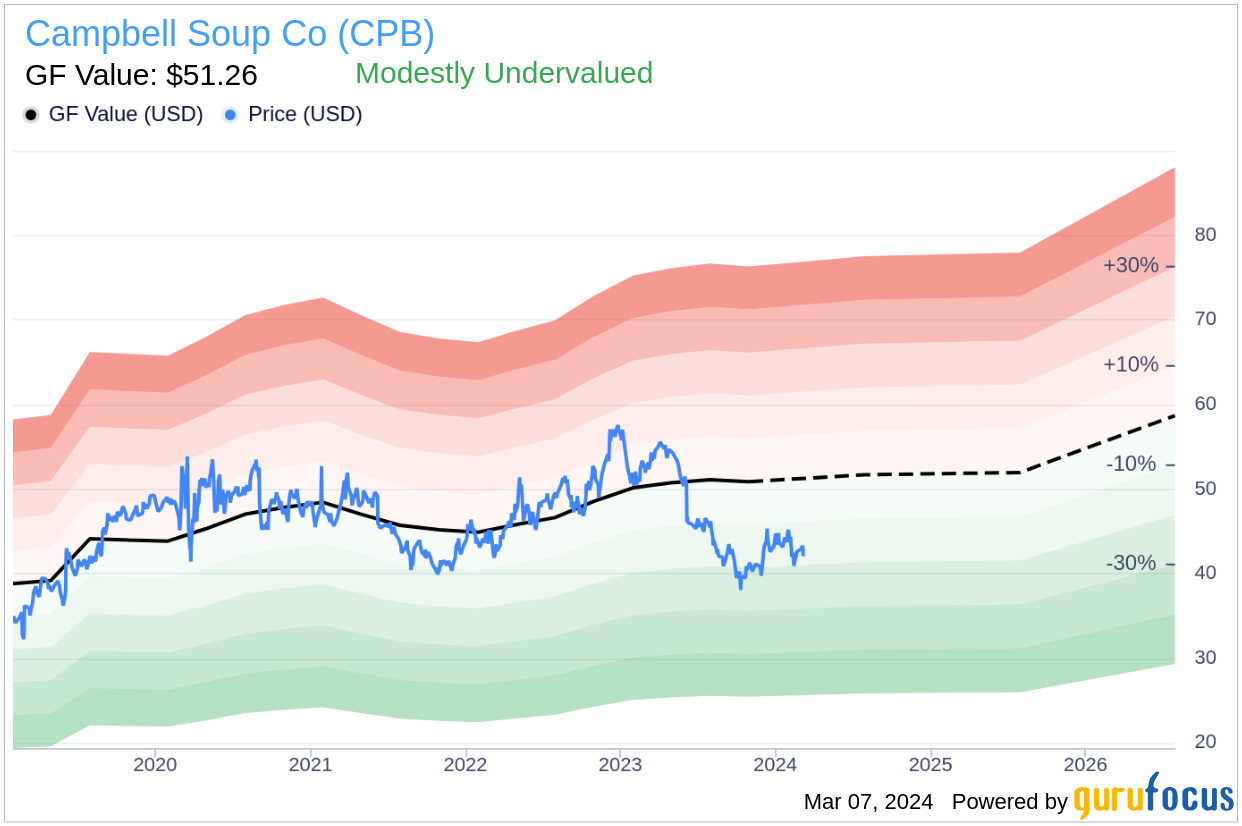
With a rich history spanning approximately 150 years, Campbell Soup Co has established itself as a leading entity in the convenience food products sector. The company's portfolio boasts iconic brands such as Campbell's, Pace, Prego, Swanson, V8, and Pepperidge Farm. Predominantly focused on the US market post the divestiture of its international snacking operations in 2019, Campbell Soup Co has recently expanded its on-trend snack offerings through strategic acquisitions like Snyder's-Lance. This move has significantly bolstered its presence in the snack aisle, complementing its Pepperidge Farm brand. Currently, with a stock price of $42.07, the market capitalization stands at $12.50 billion, inviting a comparison with the GF Value of $51.26, which suggests a potential undervaluation.
Summarize GF Value
The GF Value is a proprietary measure calculated to determine the intrinsic value of a stock. It is based on historical trading multiples, a GuruFocus adjustment factor for past performance and growth, and future business performance estimates. When a stock trades significantly above this value, it may be overvalued, suggesting a potential dip in future returns. Conversely, a stock trading below the GF Value may promise higher future returns. Campbell Soup Co, with its current price of $42.07 and a market cap of $12.50 billion, appears to be modestly undervalued by this metric, which could indicate promising long-term return prospects.
Link: These companies may deliver higher future returns at reduced risk.
Financial Strength
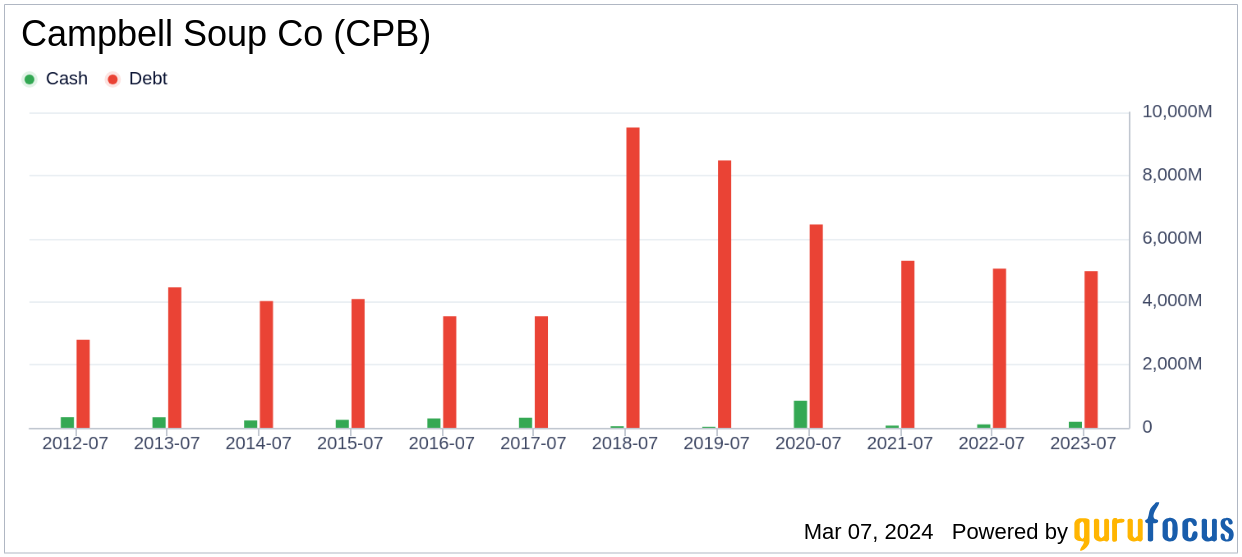
Before investing in any stock, evaluating the financial strength of the company is crucial. Campbell Soup Co's financial strength is fair, with a cash-to-debt ratio of 0.02, placing it lower than 93.83% of its peers in the Consumer Packaged Goods industry. This parameter, along with the interest coverage, helps investors gauge the risk of permanent loss associated with the company's financial obligations.
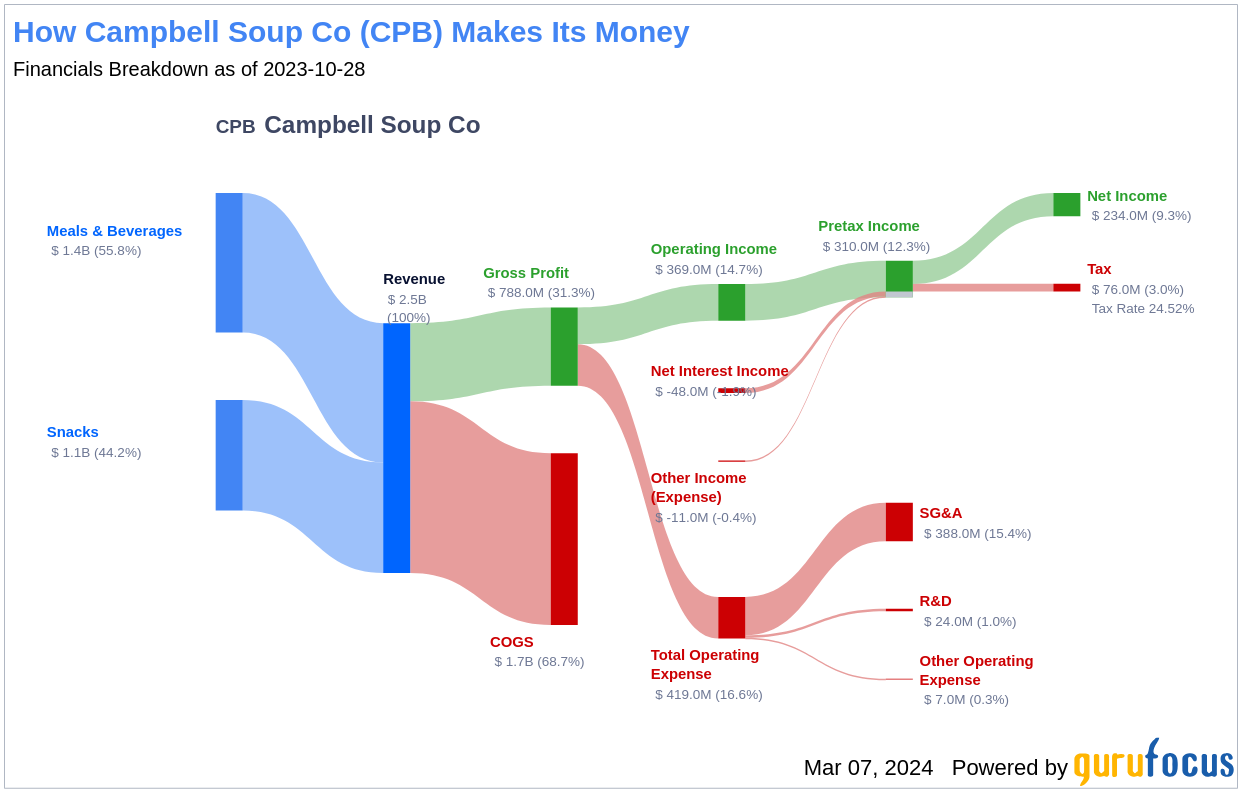
Profitability and Growth
Consistent profitability over a long period is a strong indicator of a company's risk profile and performance potential. Campbell Soup Co has maintained profitability for the last decade, showcasing revenues of $9.30 billion and an EPS of $2.56 over the past 12 months. Its operating margin surpasses 81.9% of its industry counterparts. However, when it comes to growth, Campbell Soup Co's 3-year average annual revenue growth of 2.8% and EBITDA growth rate of 6.1% rank it below many of its industry peers.
ROIC vs WACC
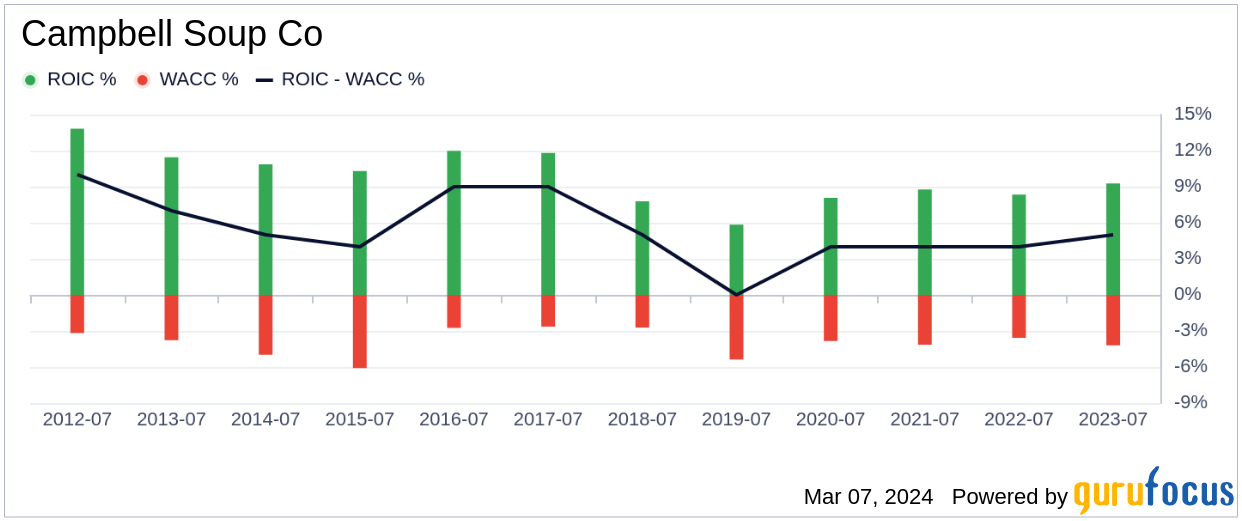
Comparing a company's Return on Invested Capital (ROIC) to its Weighted Average Cost of Capital (WACC) offers insights into its cash flow generation efficiency relative to the capital invested. Ideally, the ROIC should exceed the WACC to indicate a profitable investment. Campbell Soup Co's ROIC is 9.01, which is significantly higher than its WACC of 3.86, demonstrating the company's effective capital utilization.
Conclusion
Overall, Campbell Soup Co (CPB, Financial) presents itself as a modestly undervalued stock, with fair financial health and strong profitability. Despite its growth being less impressive compared to some industry peers, the company's effective capital management may offer favorable returns for investors. For a deeper understanding of Campbell Soup Co's financial journey, interested parties can explore its 30-Year Financials here.
To discover high-quality companies that may deliver above-average returns, consider visiting the GuruFocus High Quality Low Capex Screener.
This article, generated by GuruFocus, is designed to provide general insights and is not tailored financial advice. Our commentary is rooted in historical data and analyst projections, utilizing an impartial methodology, and is not intended to serve as specific investment guidance. It does not formulate a recommendation to purchase or divest any stock and does not consider individual investment objectives or financial circumstances. Our objective is to deliver long-term, fundamental data-driven analysis. Be aware that our analysis might not incorporate the most recent, price-sensitive company announcements or qualitative information. GuruFocus holds no position in the stocks mentioned herein.