

Amidst the daily fluctuations of the stock market, JM Smucker Co (SJM, Financial) presents an intriguing case for value investors. With a daily gain of 3.29% and a 3-month loss of 10.34%, the company's financials show a Loss Per Share of $0.87. This begs the question: is JM Smucker Co modestly undervalued? The following analysis delves into the company's current valuation, providing insights for investors seeking informed financial decisions.
Company Introduction
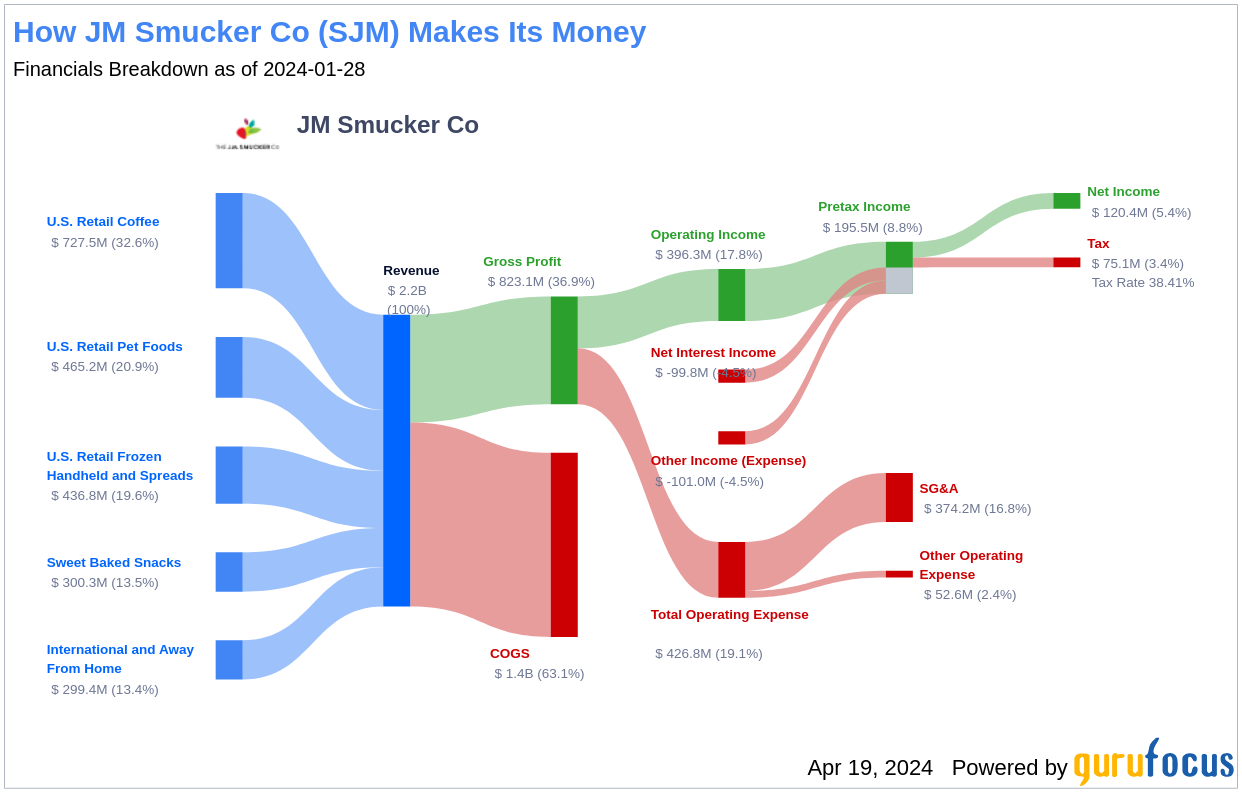
JM Smucker Co, a prominent player in the packaged food industry, has a storied history of providing consumer favorites through its retail coffee, pet foods, and consumer foods segments. With a current stock price of $114.76 and a Fair Value (GF Value) of $143.47, a preliminary comparison suggests that the company may be trading below its intrinsic value. This article aims to explore the depths of JM Smucker Co's valuation, juxtaposing its market price against the calculated GF Value to discern the potential for long-term investment returns.
Summarize GF Value
The GF Value is a proprietary measure that reflects the intrinsic value of a stock, incorporating historical trading multiples, a GuruFocus adjustment factor, and future business performance estimates. The GF Value Line serves as a benchmark, suggesting a fair trade value for the stock.
JM Smucker Co's stock appears to be modestly undervalued according to the GF Value. This assessment is grounded in a thorough analysis of historical trading patterns, the company's past growth, and projected future performance. With the stock trading at $114.76, it seems to be positioned below the GF Value Line, implying a potential for higher future returns relative to its current market valuation.
Because JM Smucker Co is relatively undervalued, the long-term return of its stock is likely to outpace its business growth, offering an attractive proposition for investors.

Financial Strength
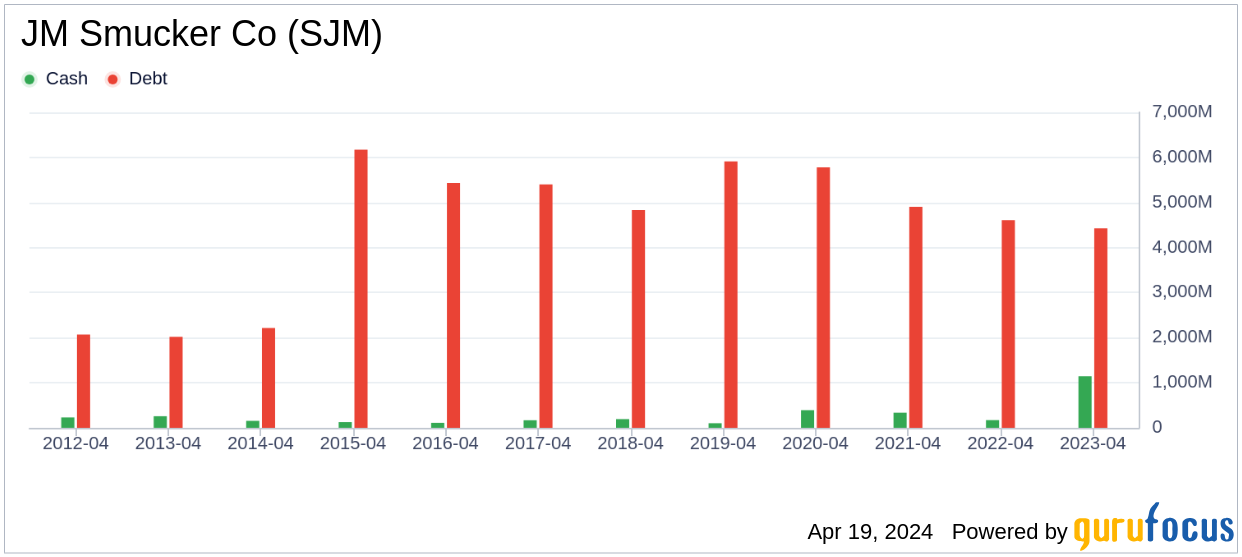
Assessing a company's financial strength is crucial to mitigate the risk of permanent capital loss. JM Smucker Co's financial strength, with a cash-to-debt ratio of 0, is considered poor within the Consumer Packaged Goods industry. The overall financial strength rating of 4 out of 10 further underscores the need for careful analysis before investment decisions are made.
Profitability and Growth
Consistent profitability is a hallmark of a less risky investment. JM Smucker Co has demonstrated profitability over the past decade, with a robust operating margin of 16.97%, ranking higher than most in its industry. However, the company's growth trajectory has been less impressive, with revenue and EBITDA growth trailing behind industry peers. This mixed profitability and growth profile warrants a nuanced approach to evaluating the company's long-term value creation potential.
ROIC vs. WACC
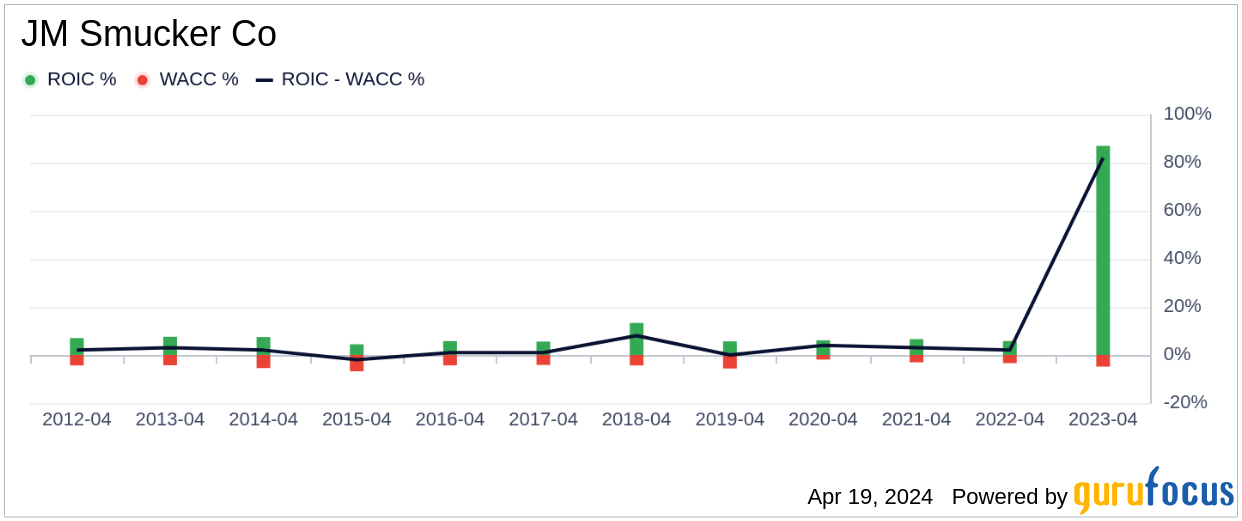
Evaluating a company's value creation can also be done by comparing its Return on Invested Capital (ROIC) to its Weighted Average Cost of Capital (WACC). A higher ROIC than WACC indicates effective capital allocation. Unfortunately, JM Smucker Co's recent ROIC of -210.78 starkly contrasts with its WACC of 4.1, suggesting challenges in generating adequate cash flow from invested capital.
Conclusion
In summary, JM Smucker Co (SJM, Financial) presents itself as modestly undervalued. Despite its fair profitability, the company's financial condition raises questions, and its growth ranks below many peers in the industry. For a more comprehensive understanding of JM Smucker Co's financials, investors are encouraged to review its 30-Year Financials here.
To discover high-quality companies that may deliver above-average returns, please check out the GuruFocus High Quality Low Capex Screener.
This article, generated by GuruFocus, is designed to provide general insights and is not tailored financial advice. Our commentary is rooted in historical data and analyst projections, utilizing an impartial methodology, and is not intended to serve as specific investment guidance. It does not formulate a recommendation to purchase or divest any stock and does not consider individual investment objectives or financial circumstances. Our objective is to deliver long-term, fundamental data-driven analysis. Be aware that our analysis might not incorporate the most recent, price-sensitive company announcements or qualitative information. GuruFocus holds no position in the stocks mentioned herein.