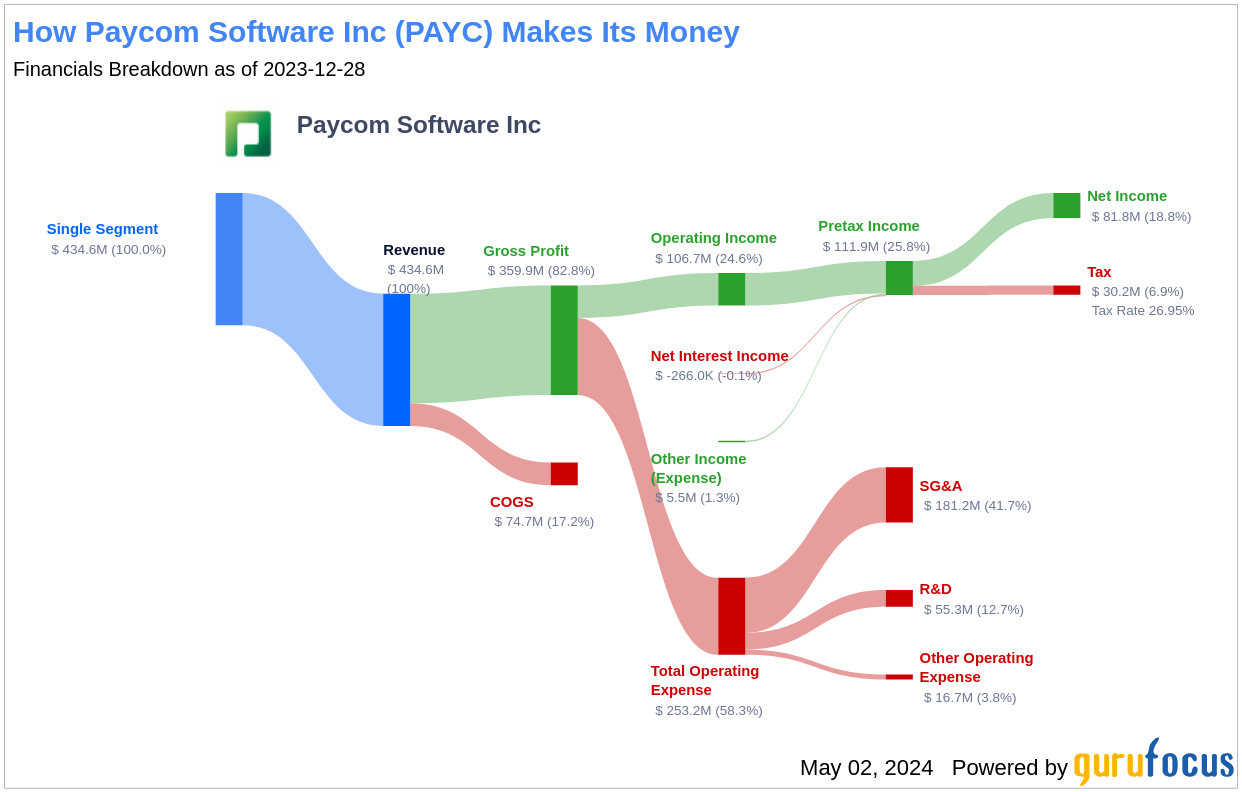
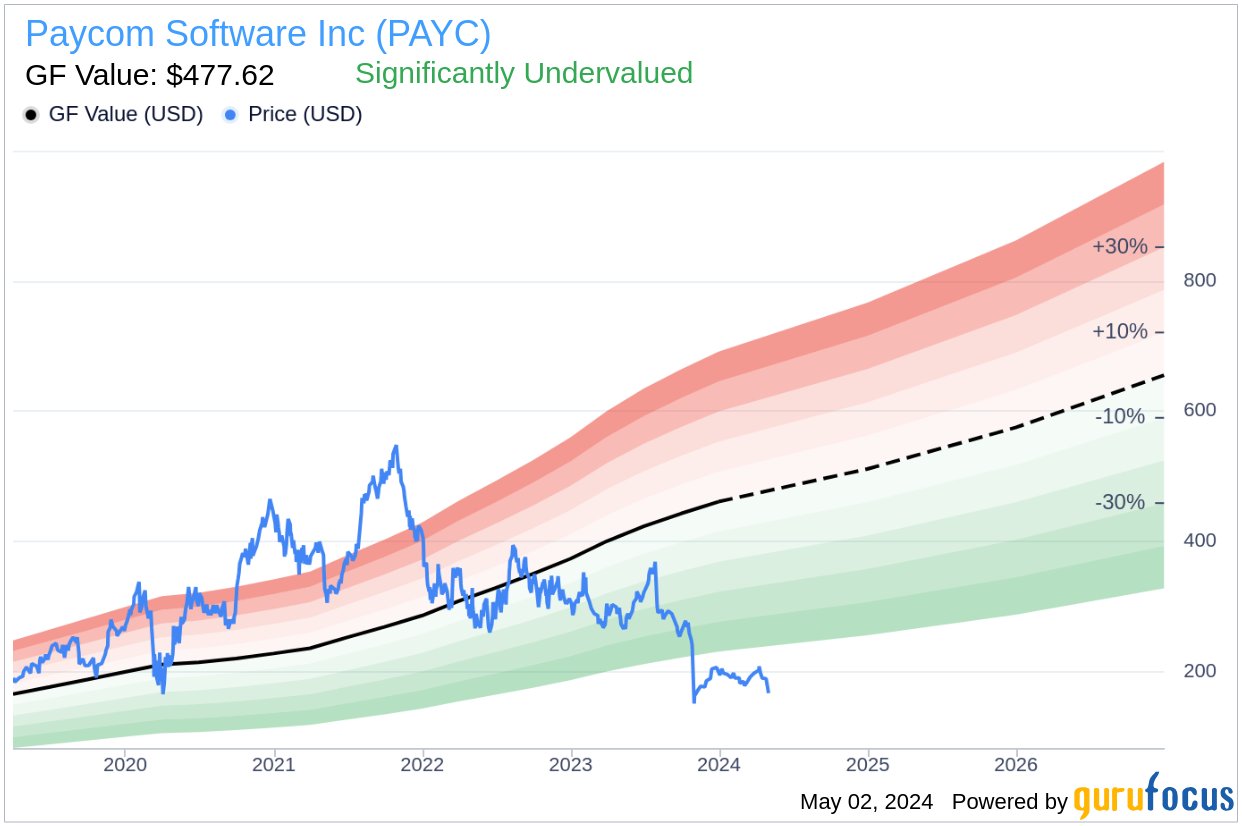
Recent fluctuations in the stock market have left many investors questioning the true value of their investments. Paycom Software Inc (PAYC, Financial), with a significant daily loss of 10.48% and a three-month decline of 14.18%, presents a curious case. Despite these setbacks, the company boasts a robust Earnings Per Share (EPS) of 8.21. This analysis seeks to determine whether Paycom Software is indeed significantly undervalued as suggested by the GF Value, which currently stands at $477.62 per share.
Company Overview
Founded in 1998, Paycom Software has grown into a leading provider of payroll and human capital management (HCM) software solutions, catering primarily to mid-sized companies across the United States. From its core payroll software to a suite of supplementary HCM modules like talent management and benefits administration, Paycom Software serves approximately 19,500 clients. With a market cap of $9.70 billion and sales reaching $1.70 billion, the company's financial health appears robust. Yet, the current stock price of $166.72 suggests a potential undervaluation, which merits a deeper financial exploration.
Understanding GF Value
The GF Value is a proprietary measure calculated to represent the intrinsic value of a stock. It incorporates historical trading multiples, a GuruFocus adjustment factor based on past performance and growth, and future business performance estimates. Currently, the GF Value for Paycom Software stands significantly above its market price, indicating that the stock might be undervalued. This discrepancy suggests that investors could potentially enjoy higher future returns relative to the company's business growth.
Financial Strength and Stability
Investing in a company with solid financial health reduces the risk of loss. Paycom Software's cash-to-debt ratio of 12.8 not only outperforms 67.97% of its industry peers but also underscores its financial stability. The company's financial strength rating of 8 out of 10 reinforces its capacity to manage debt effectively and sustain its operational needs.
Profitability and Growth Prospects
Paycom Software has consistently demonstrated strong profitability, with an impressive operating margin of 33.11%, ranking it higher than 94.12% of its industry counterparts. The company's track record of profitability over the past decade and its substantial revenue growth rate of 26.5% over the past three years highlight its effectiveness in capitalizing on market opportunities and enhancing shareholder value.
Efficient Capital Utilization
A critical aspect of assessing a company's profitability is comparing its return on invested capital (ROIC) with its weighted average cost of capital (WACC). Paycom Software's ROIC of 12.56% exceeds its WACC of 10.66%, indicating efficient use of capital in generating profitable returns. This relationship suggests that Paycom is creating substantial value for its shareholders.
Conclusion
In conclusion, despite recent price drops, the financial analysis and GF Value indicate that Paycom Software Inc (PAYC, Financial) is significantly undervalued. The company's strong financial health, coupled with its robust profitability and efficient capital utilization, positions it favorably for potential investors seeking long-term growth. For more detailed financial insights, consider exploring Paycom Software's 30-Year Financials here.
To discover other high-quality companies that may deliver above-average returns, check out the GuruFocus High Quality Low Capex Screener.
This article, generated by GuruFocus, is designed to provide general insights and is not tailored financial advice. Our commentary is rooted in historical data and analyst projections, utilizing an impartial methodology, and is not intended to serve as specific investment guidance. It does not formulate a recommendation to purchase or divest any stock and does not consider individual investment objectives or financial circumstances. Our objective is to deliver long-term, fundamental data-driven analysis. Be aware that our analysis might not incorporate the most recent, price-sensitive company announcements or qualitative information. GuruFocus holds no position in the stocks mentioned herein.


