

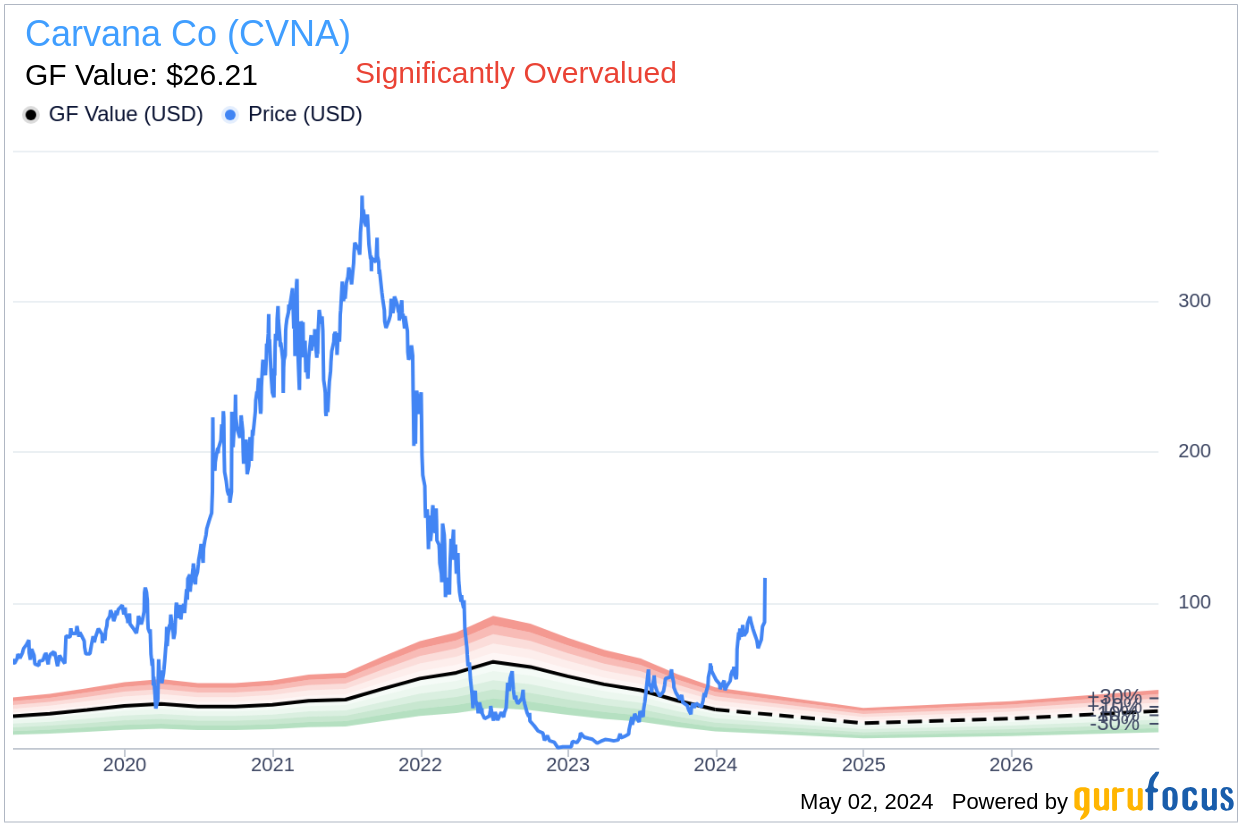
Carvana Co (CVNA, Financial) recently reported a significant daily gain of 33.77% and an impressive three-month gain of 167.8%. Despite these gains, a critical evaluation based on the Earnings Per Share (EPS) of 2.16 suggests that the stock might be significantly overvalued. This analysis aims to delve into whether Carvana Co's current market price truly reflects its intrinsic value as calculated by the GF Value.
Company Overview
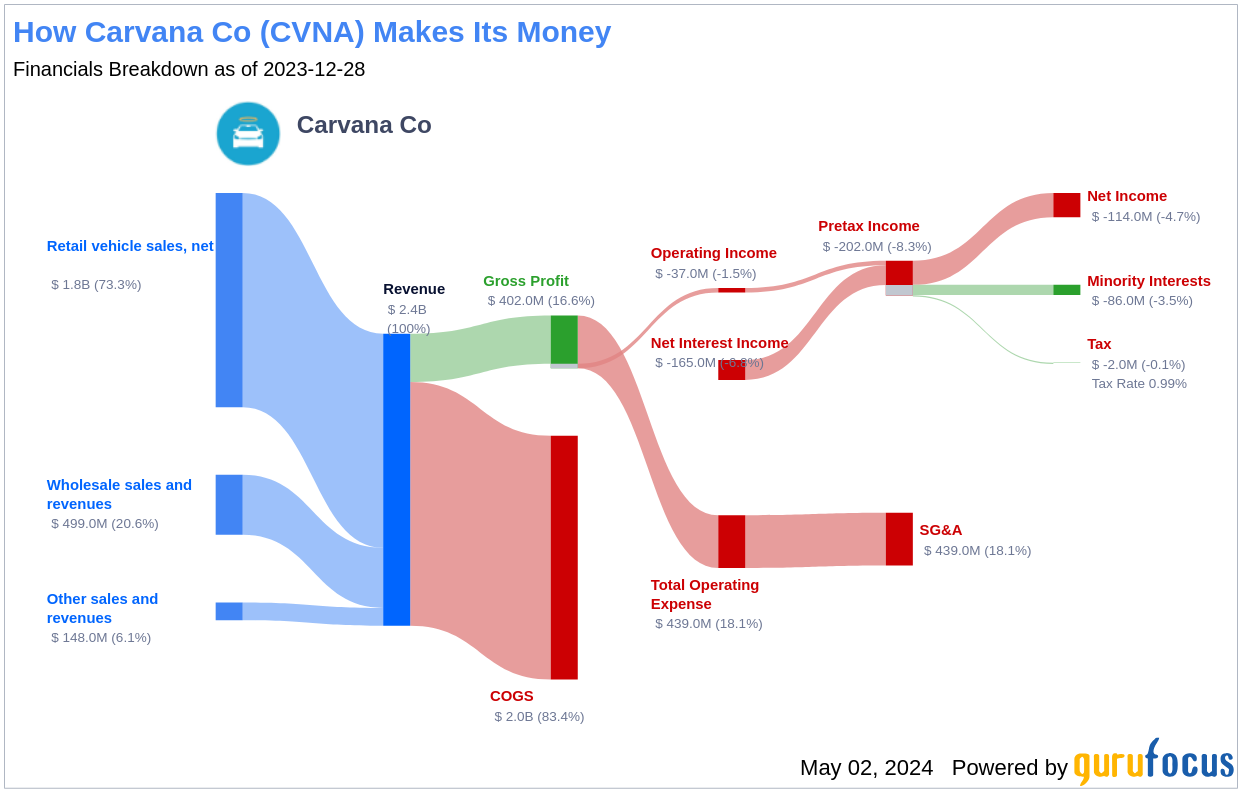
Carvana Co operates a robust e-commerce platform for buying and selling used cars, generating revenue primarily through used vehicle sales. Additional revenue streams include wholesale vehicle sales and commissions from vehicle service contracts (VSCs), auto insurance, and gap waiver coverage. The company's business model is anchored in retail vehicle sales, which not only drives the majority of its revenue but also enables it to capitalize on various associated financial services.
Understanding GF Value
The GF Value is a proprietary measure reflecting the true intrinsic value of a stock. It incorporates historical trading multiples such as PE, PS, PB ratios, and Price-to-Free-Cash-Flow, adjusts for past business performance, and considers analyst estimates of future business performance. This comprehensive approach suggests that Carvana Co's fair market value is significantly lower than its current trading price, indicating that the stock is potentially overvalued.
Financial Strength and Risks
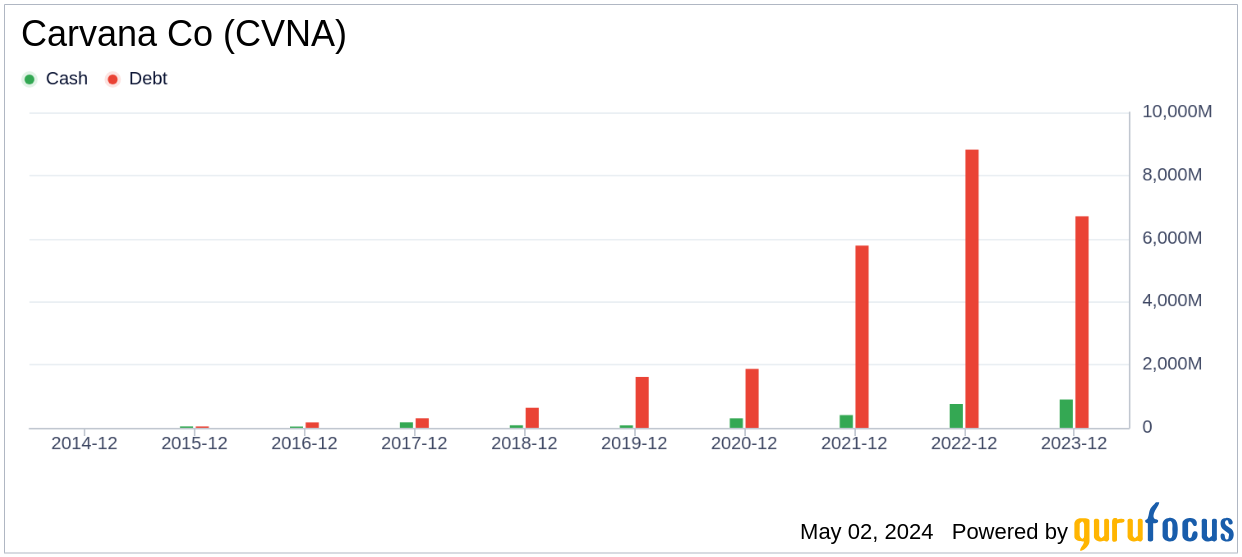
Investing in companies with robust financial health is crucial to minimizing the risk of capital loss. Carvana Co's cash-to-debt ratio of 0.04 ranks lower than 80.69% of its peers in the Vehicles & Parts industry, indicating a weaker financial position. This is reflected in GuruFocus's financial strength rating of 3 out of 10 for Carvana Co.
Profitability and Growth Prospects
Carvana Co's profitability has been underwhelming, with an operating margin of 1.72%, which is lower than 81.18% of its industry counterparts. Additionally, the company has shown a disturbing trend in revenue growth, with an average annual decline of 14.5%, positioning it unfavorably against industry peers.
ROIC vs. WACC: A Critical Indicator
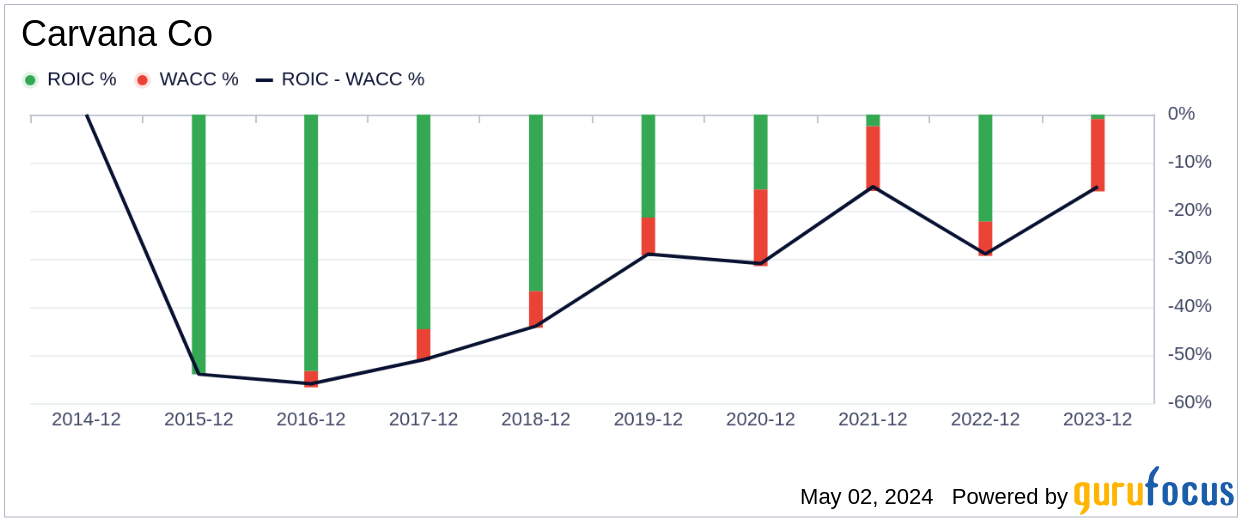
The comparison between the Return on Invested Capital (ROIC) and the Weighted Average Cost of Capital (WACC) is essential for assessing value creation. Carvana Co's ROIC of 2.86% is significantly lower than its WACC of 20.01%, suggesting that the company is not generating adequate returns relative to its cost of capital.
Conclusion
In conclusion, while Carvana Co (CVNA, Financial) has shown remarkable market performance in recent months, its underlying financial strength, profitability, and growth metrics suggest that it is significantly overvalued. Investors should exercise caution and consider the long-term potential based on these financial health indicators. For a deeper understanding of Carvana Co's financials, visit the 30-Year Financials here.
To discover high-quality companies that may deliver above-average returns, check out the GuruFocus High Quality Low Capex Screener.
This article, generated by GuruFocus, is designed to provide general insights and is not tailored financial advice. Our commentary is rooted in historical data and analyst projections, utilizing an impartial methodology, and is not intended to serve as specific investment guidance. It does not formulate a recommendation to purchase or divest any stock and does not consider individual investment objectives or financial circumstances. Our objective is to deliver long-term, fundamental data-driven analysis. Be aware that our analysis might not incorporate the most recent, price-sensitive company announcements or qualitative information. GuruFocus holds no position in the stocks mentioned herein.