

EPAM Systems Inc (EPAM, Financial) recently experienced a daily gain of 3.99%, yet it has seen a significant three-month loss of -30.02%. With an Earnings Per Share (EPS) of 7.31, investors might wonder if the stock is significantly undervalued. This article delves into the GF Value to determine if EPAM Systems (EPAM) is indeed a bargain at its current market price.
Company Overview
EPAM Systems is a prominent IT services firm with a major presence in North America, accounting for about 60% of its revenues. The company specializes in platform engineering, software development, and consulting, with a focus on cutting-edge technologies such as artificial intelligence, virtual reality, and robotics. With a current stock price of $190.72 and a market cap of $11.10 billion, EPAM Systems appears significantly undervalued when compared to the GF Value of $339.74, suggesting a potentially lucrative opportunity for investors.

Understanding GF Value
The GF Value is a unique valuation metric used to determine the intrinsic value of a stock. It incorporates historical trading multiples, a GuruFocus adjustment factor based on past performance and growth, and future business performance estimates. For EPAM Systems, the GF Value suggests that the stock should ideally trade at $339.74, significantly higher than its current price. This discrepancy indicates that EPAM Systems is potentially undervalued, offering an attractive entry point for long-term investors.

Financial Strength and Stability
Financial strength is crucial for assessing a company's risk of capital loss. EPAM Systems boasts a strong financial strength rating of 9 out of 10, supported by a cash-to-debt ratio of 11.87, which is higher than 69.32% of its industry peers. This robust financial health reduces the risk of investment and supports the company's ability to invest in future growth opportunities.

Profitability and Growth Prospects
EPAM Systems has consistently demonstrated strong profitability, with an operating margin of 11.14%, ranking it higher than 74.99% of its competitors in the software industry. Furthermore, the company's 3-year average annual revenue growth rate of 20.4% underscores its ability to expand effectively. However, its EBITDA growth rate at 8.7% suggests some areas for improvement.
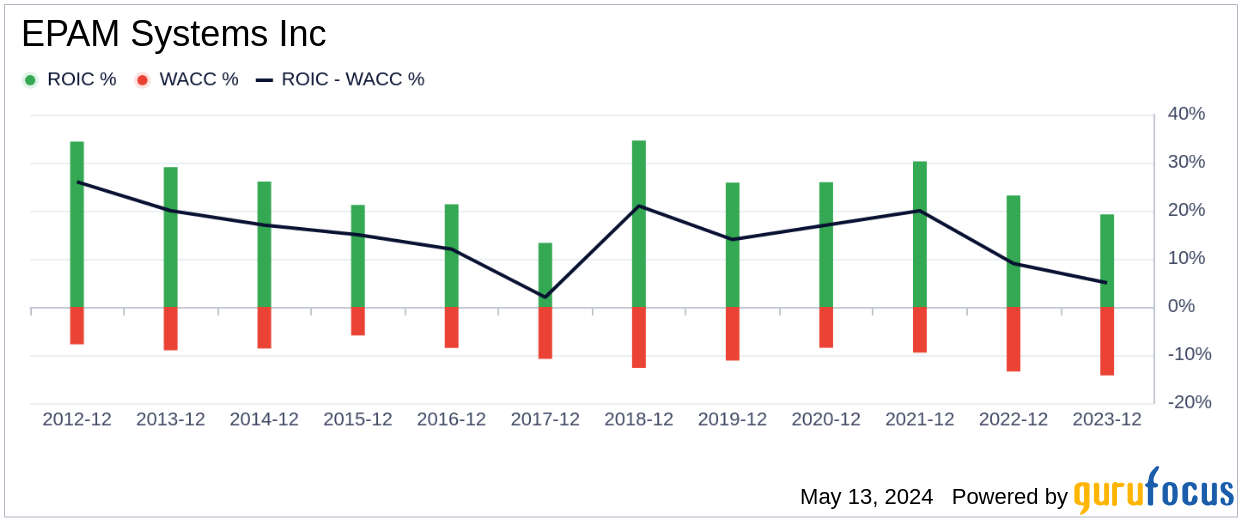
Value Creation Analysis: ROIC vs. WACC
Comparing the Return on Invested Capital (ROIC) and the Weighted Average Cost of Capital (WACC) provides insights into how effectively a company is creating value. EPAM Systems has a ROIC of 20.02%, exceeding its WACC of 14.46%, indicating efficient value creation for shareholders.
Conclusion
In conclusion, EPAM Systems (EPAM, Financial) presents a compelling investment opportunity as it is currently priced well below its calculated GF Value. The company's strong financial health, impressive profitability, and effective value creation suggest potential for significant long-term gains. For more detailed financial analysis, interested investors can explore EPAM Systems' 30-Year Financials here.
To discover other high-quality companies that may deliver above-average returns, please check out the GuruFocus High Quality Low Capex Screener.
This article, generated by GuruFocus, is designed to provide general insights and is not tailored financial advice. Our commentary is rooted in historical data and analyst projections, utilizing an impartial methodology, and is not intended to serve as specific investment guidance. It does not formulate a recommendation to purchase or divest any stock and does not consider individual investment objectives or financial circumstances. Our objective is to deliver long-term, fundamental data-driven analysis. Be aware that our analysis might not incorporate the most recent, price-sensitive company announcements or qualitative information. GuruFocus holds no position in the stocks mentioned herein.