

Today, Palo Alto Networks Inc (PANW, Financial) experienced a daily loss of 2.28%, yet it has seen a gain of 20.43% over the past three months. With an Earnings Per Share (EPS) of 6.4, investors are prompted to question: is the stock significantly overvalued? This article delves into the valuation analysis of Palo Alto Networks, aiming to provide a clear perspective on its current market standing.
Company Introduction
Palo Alto Networks is a leading platform-based cybersecurity vendor, offering solutions across network security, cloud security, and security operations. Based in California, the company serves over 85,000 customers worldwide, including more than three-fourths of the Global 2000. A critical look at its stock price compared to the GF Value, which is estimated at $231.82, suggests that the stock might be significantly overvalued. This valuation discrepancy sets the stage for a deeper exploration of the company's intrinsic worth.

Understanding the GF Value
The GF Value is a proprietary measure calculated to represent the true intrinsic value of a stock. It incorporates historical trading multiples, a GuruFocus adjustment factor based on past performance and growth, and estimated future business performance. Currently, the GF Value for Palo Alto Networks Inc (PANW, Financial) suggests that the stock is trading well above its fair value, indicating a potentially overvalued status which could lead to poorer future returns.

Financial Strength and Risks
Assessing the financial strength of Palo Alto Networks is crucial to understanding its risk profile. The company's cash-to-debt ratio stands at 1.54, which is lower than 57.7% of its peers in the Software industry. This ratio, along with a fair financial strength rating of 7 out of 10, suggests that while Palo Alto Networks is reasonably stable, there are areas where risk could be better managed.

Profitability and Growth Prospects
Palo Alto Networks has shown consistent profitability with an operating margin of 7.98%, ranking better than 64.88% of companies in the Software industry. Moreover, its revenue growth rate of 19.8% annually positions it favorably against industry competitors. The company's significant 3-year average EBITDA growth rate of 131.4% underscores its potential for future value creation, making it an attractive prospect for growth-focused investors.
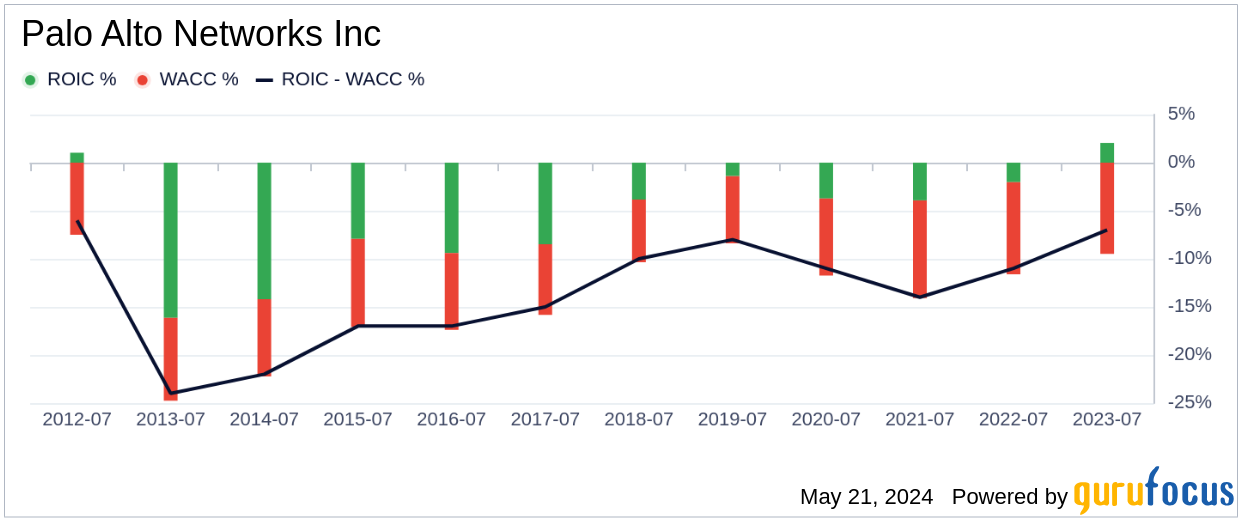
ROIC vs. WACC: A Key Indicator of Efficiency
An effective way to gauge a company's efficiency in generating returns on investment is by comparing its Return on Invested Capital (ROIC) against the Weighted Average Cost of Capital (WACC). For Palo Alto Networks, the ROIC is 9.67, which is higher than its WACC of 8.63. This indicates that the company is creating value as it is earning more than its cost of capital.
Conclusion
While Palo Alto Networks (PANW, Financial) shows strong growth prospects and efficient capital usage, its current market price significantly exceeds the GF Value estimate, suggesting it is overvalued. Investors should consider this analysis carefully and monitor the company's ongoing financial health and market position. For more detailed financial insights into Palo Alto Networks, you can view its 30-Year Financials here.
To discover high-quality companies that may deliver above-average returns, check out the GuruFocus High Quality Low Capex Screener.
This article, generated by GuruFocus, is designed to provide general insights and is not tailored financial advice. Our commentary is rooted in historical data and analyst projections, utilizing an impartial methodology, and is not intended to serve as specific investment guidance. It does not formulate a recommendation to purchase or divest any stock and does not consider individual investment objectives or financial circumstances. Our objective is to deliver long-term, fundamental data-driven analysis. Be aware that our analysis might not incorporate the most recent, price-sensitive company announcements or qualitative information. GuruFocus holds no position in the stocks mentioned herein.