
Gartner Inc (IT, Financial) has recently captured the attention of investors and financial analysts with its strong financial performance. Currently trading at $450.85 per share, Gartner Inc has experienced a modest daily increase of 0.33%, despite a slight three-month decline of 0.27%. A detailed evaluation using the GF Score indicates that Gartner Inc is poised for significant growth, backed by solid financial metrics and strategic market positioning.
What Is the GF Score?
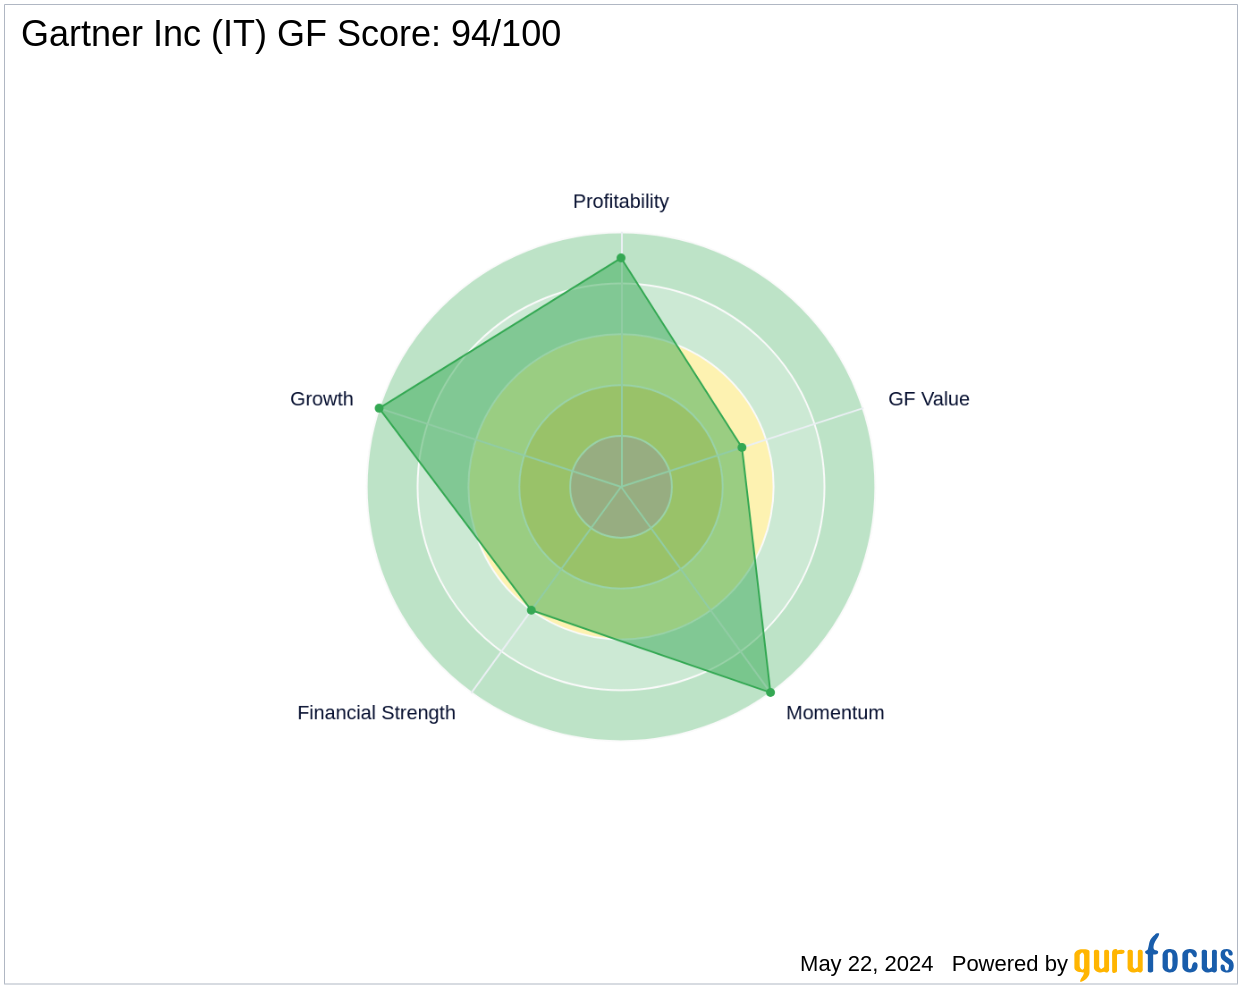
The GF Score is a proprietary ranking system from GuruFocus, designed to predict stock performance by evaluating five key aspects of a company's financials. This system, which has been rigorously backtested from 2006 to 2021, suggests that stocks with higher GF Scores typically yield better returns. For Gartner Inc, the GF Score is an impressive 94 out of 100, indicating a strong potential for market outperformance. This score is supported by Gartner Inc's high ranks in profitability (9/10), growth (10/10), and momentum (10/10), although its financial strength (6/10) and GF Value (5/10) scores are moderate.
Understanding Gartner Inc's Business
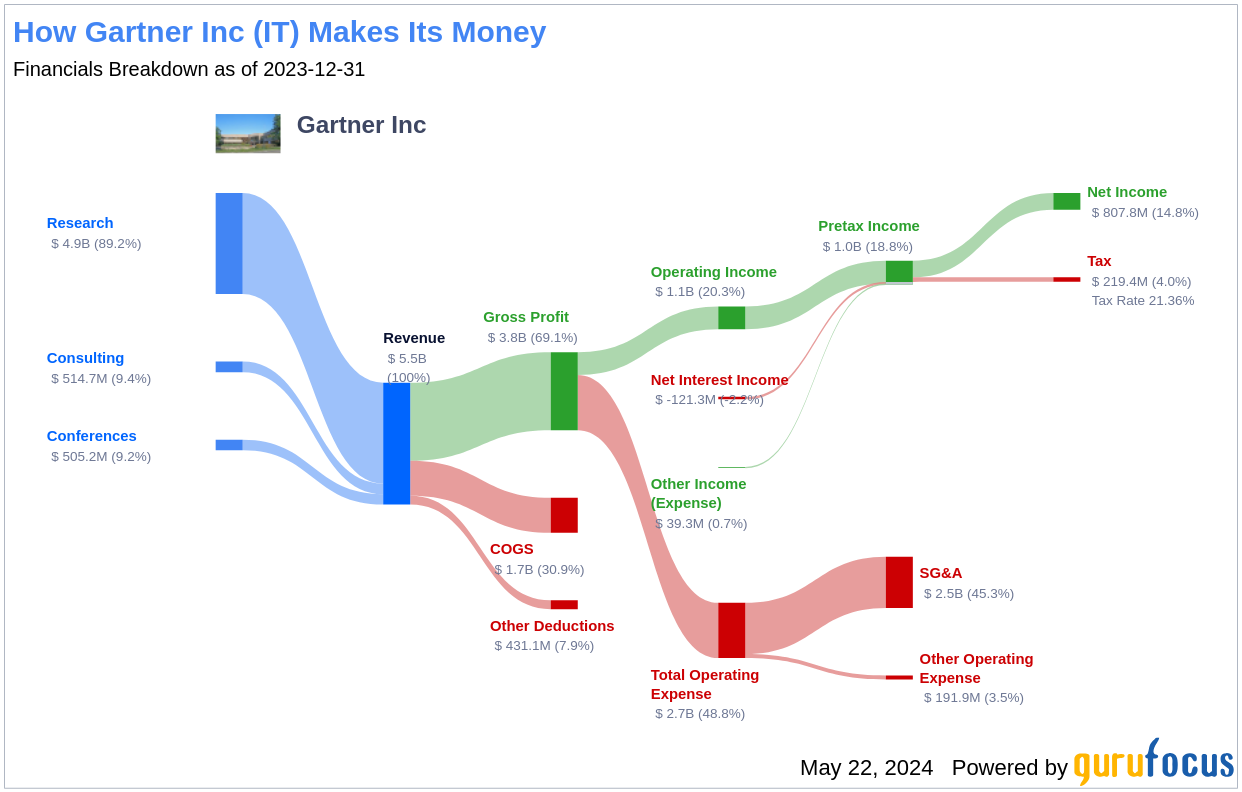
Headquartered in Stamford, Connecticut, Gartner Inc specializes in providing critical research and analysis in IT and related technology sectors. The company serves a diverse clientele, including chief information officers and business executives, helping them navigate technology planning and budgeting. Gartner Inc operates through three main segments: Research, Conferences, and Consulting, with the majority of its revenue stemming from its Research division. With a market cap of $34.99 billion and annual sales of $5.97 billion, Gartner boasts an operating margin of 18.68%, reflecting its efficient operational structure.
Financial Strength Breakdown
Gartner Inc's financial resilience is evident through its robust balance sheet and strategic debt management. The company's Interest Coverage ratio stands at an impressive 8.95, significantly above Benjamin Graham's recommended threshold of 5, indicating strong earnings relative to interest obligations. Additionally, with an Altman Z-Score of 5.11, Gartner Inc is well-protected against financial distress. The Debt-to-Revenue ratio of 0.49 further underscores the company's prudent financial management.
Profitability and Growth Metrics
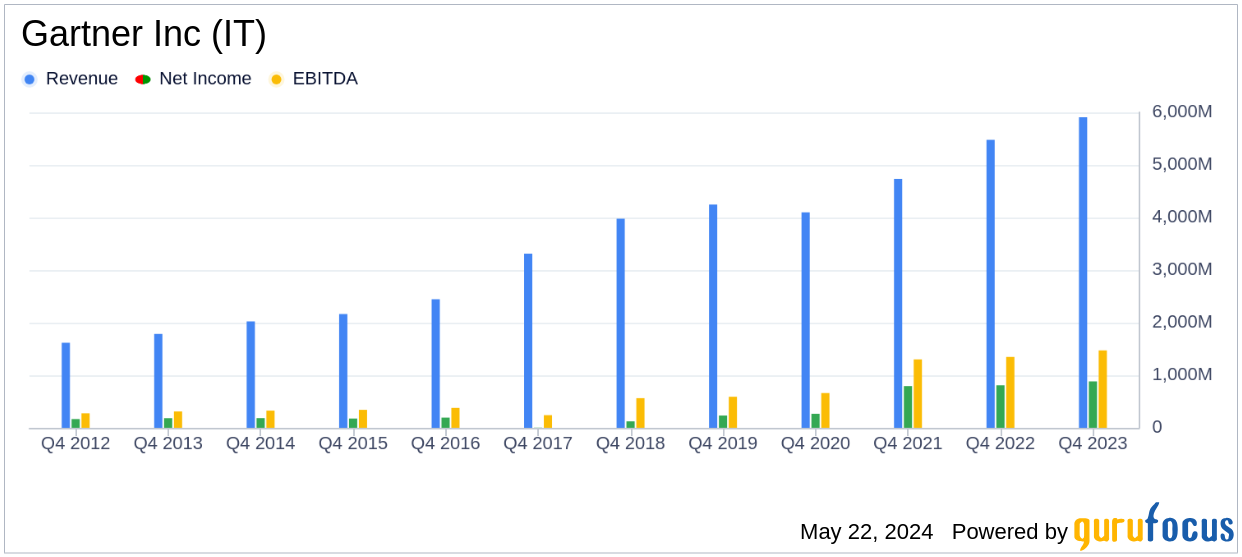
Gartner Inc's profitability is highlighted by its increasing operating margin, which has grown from 8.94% in 2019 to 18.81% in 2023. This trend demonstrates Gartner's enhanced ability to convert revenue into profit, supported by a consistent rise in gross margin over the same period. The company's growth is equally commendable, with a 3-Year Revenue Growth Rate of 17.6%, outperforming 69.86% of its peers in the software industry. This is complemented by a strong EBITDA growth, further emphasizing Gartner's growth trajectory.
Conclusion: Gartner Inc's Market Position and Future Outlook
Considering Gartner Inc's robust financial strength, impressive profitability, and consistent growth metrics, the GF Score effectively highlights the company's superior position for potential market outperformance. Investors looking for similar opportunities can explore other high-performing companies using the GF Score Screen provided by GuruFocus.
This article, generated by GuruFocus, is designed to provide general insights and is not tailored financial advice. Our commentary is rooted in historical data and analyst projections, utilizing an impartial methodology, and is not intended to serve as specific investment guidance. It does not formulate a recommendation to purchase or divest any stock and does not consider individual investment objectives or financial circumstances. Our objective is to deliver long-term, fundamental data-driven analysis. Be aware that our analysis might not incorporate the most recent, price-sensitive company announcements or qualitative information. GuruFocus holds no position in the stocks mentioned herein.