

Value-focused investors are always on the lookout for stocks that seem undervalued compared to their intrinsic value. One such intriguing case is Norwegian Cruise Line Holdings Ltd (NCLH, Financial), which is currently trading at $16.65, reflecting a notable 4.03% gain in a single day, despite a 3-month decrease of 10.44%. The GF Value of the stock is pegged at $37.8, suggesting a significant undervaluation.
Understanding GF Value
The GF Value is a unique valuation metric developed by GuruFocus to estimate the fair value of a stock. It integrates historical trading multiples such as PE Ratio, PS Ratio, PB Ratio, and Price-to-Free-Cash-Flow with adjustments based on the company's past performance and growth, as well as future business expectations. The essence of GF Value lies in its ability to indicate whether a stock is overvalued, fairly valued, or undervalued relative to its current market price.
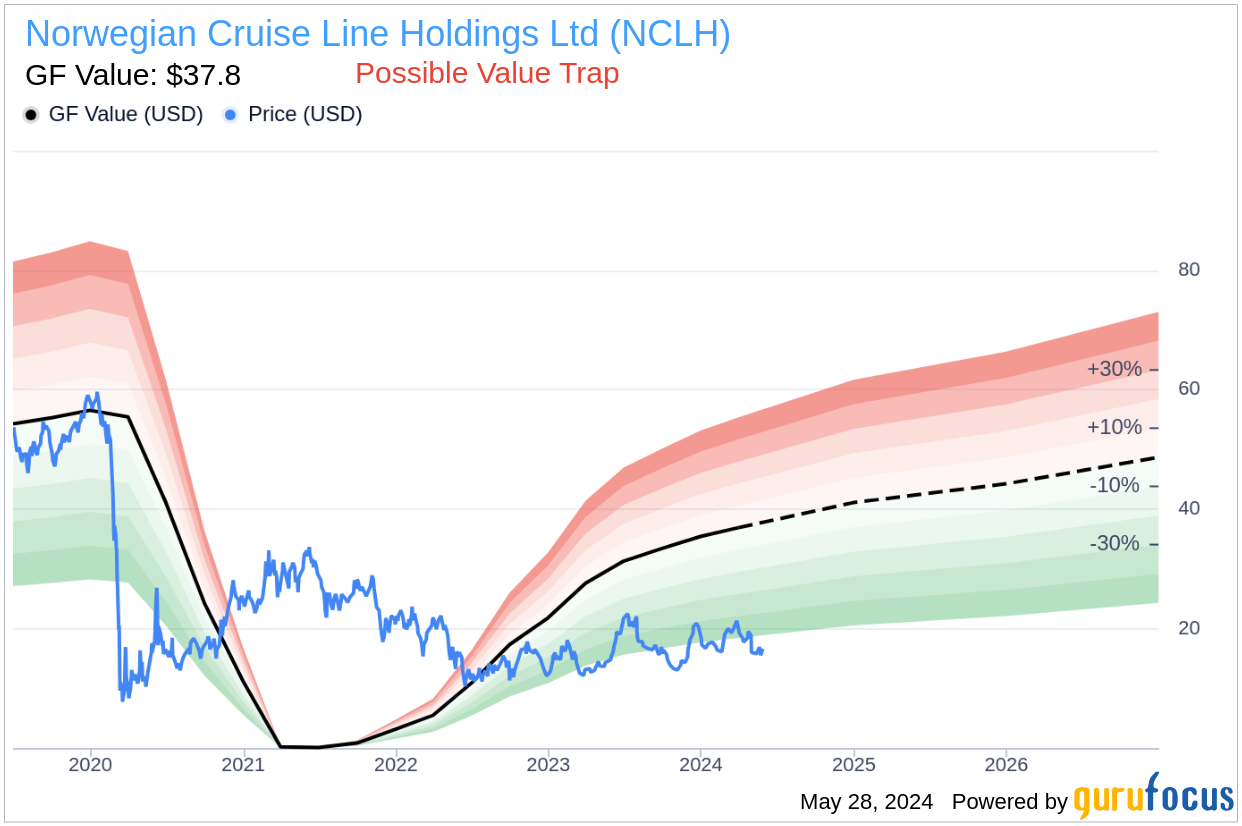
While Norwegian Cruise Line Holdings appears to be a bargain at first glance, a deeper dive into its financial health and market position is crucial before considering an investment. Particularly concerning are its low Altman Z-score of 0.06 and a persistent decline in revenue and Earnings Per Share (EPS) over the past five years. These factors raise a critical question: is Norwegian Cruise Line Holdings a hidden gem or a value trap?
The Significance of Altman Z-Score
The Altman Z-score, developed by Professor Edward I. Altman in 1968, is a financial model that predicts the likelihood of a company facing bankruptcy within the next two years. The score is derived from five different financial ratios and provides a clear indicator of a company's financial health. A score below 1.8 suggests a high risk of financial distress, while a score above 3 indicates stability. Norwegian Cruise Line Holdings's extremely low Z-score is a red flag for potential investors.
Financial Performance and Market Challenges
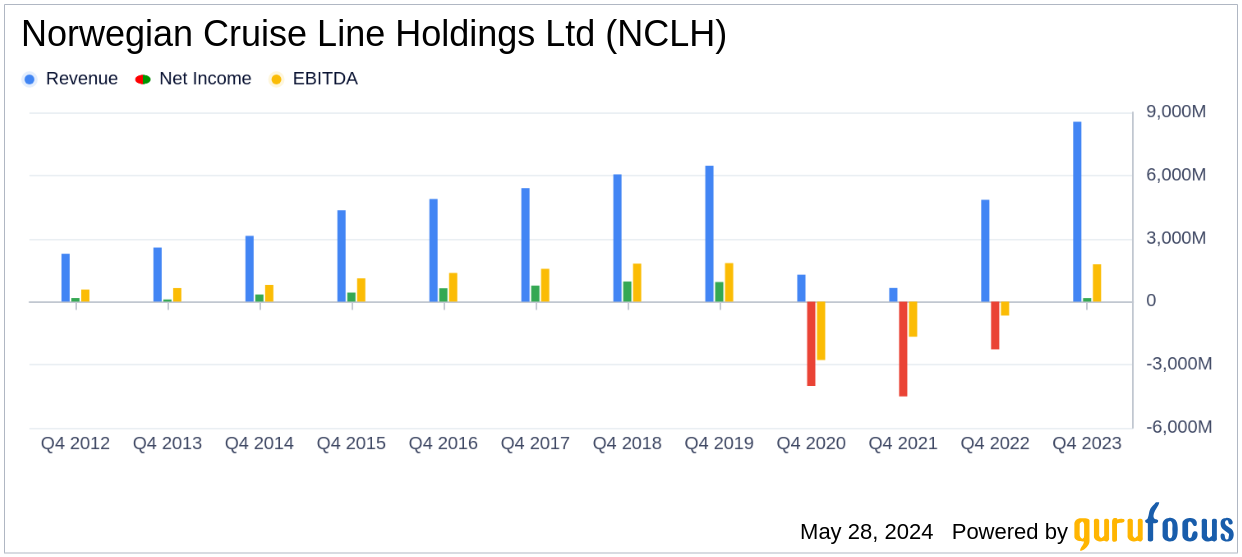
A look at Norwegian Cruise Line Holdings's financial performance reveals a troubling trend. The company's revenue per share has seen a significant decline, moving from $29.29 in 2020 to $19.49 in 2024, alongside a negative five-year revenue growth rate of -14.3%. This declining trajectory in revenues and earnings is an indicator of potential underlying issues such as reduced demand for its offerings or increasing competition, which could severely impact the company's future profitability and market position.
Assessing Investment Risks
Despite its appealing low price relative to the GF Value, the financial challenges faced by Norwegian Cruise Line Holdings cast a long shadow over its attractiveness as an investment. Declining revenues, coupled with a lack of evident strategic direction for a turnaround, suggest that the company's current undervaluation might actually represent a value trap rather than an investment opportunity.
Conclusion
While the low stock price of Norwegian Cruise Line Holdings might tempt value investors, the significant financial and operational risks highlighted by its low Altman Z-score and declining revenue and earnings growth strongly suggest the stock could be a value trap. Investors are advised to perform thorough due diligence and consider the potential long-term risks associated with this investment. For those looking for more secure investment opportunities, exploring stocks with higher Altman Z-scores and positive revenue and earnings growth trajectories on platforms like GuruFocus might be a wiser strategy.
Explore high-quality stocks with our Walter Schloss Screen or discover growth opportunities with the Peter Lynch Growth with Low Valuation Screener exclusively on GuruFocus.
This article, generated by GuruFocus, is designed to provide general insights and is not tailored financial advice. Our commentary is rooted in historical data and analyst projections, utilizing an impartial methodology, and is not intended to serve as specific investment guidance. It does not formulate a recommendation to purchase or divest any stock and does not consider individual investment objectives or financial circumstances. Our objective is to deliver long-term, fundamental data-driven analysis. Be aware that our analysis might not incorporate the most recent, price-sensitive company announcements or qualitative information. GuruFocus holds no position in the stocks mentioned herein.