
JB Hunt Transport Services Inc (JBHT, Financial) has recently captured the attention of investors and financial analysts alike, thanks to its strong financial performance and promising growth prospects. With a current share price of $171.01 and a daily gain of 2.92%, despite a three-month decline of -7.42%, the company's resilience and potential for future growth are evident. A detailed analysis, supported by the GF Score, positions JB Hunt Transport Services Inc as a compelling candidate for substantial future growth.

What Is the GF Score?
The GF Score is a proprietary ranking system developed by GuruFocus, assessing stocks based on five key valuation aspects. These aspects have shown a strong correlation with long-term stock performance from 2006 to 2021. Stocks with higher GF Scores typically yield higher returns. The GF Score ranges from 0 to 100, with 100 indicating the highest potential for outperformance. JB Hunt Transport Services Inc boasts a GF Score of 94, signaling significant outperformance potential. The company excels in several areas:
- Financial strength rank: 7/10
- Profitability rank: 9/10
- Growth rank: 10/10
- GF Value rank: 7/10
- Momentum rank: 5/10
Understanding JB Hunt Transport Services Inc's Business
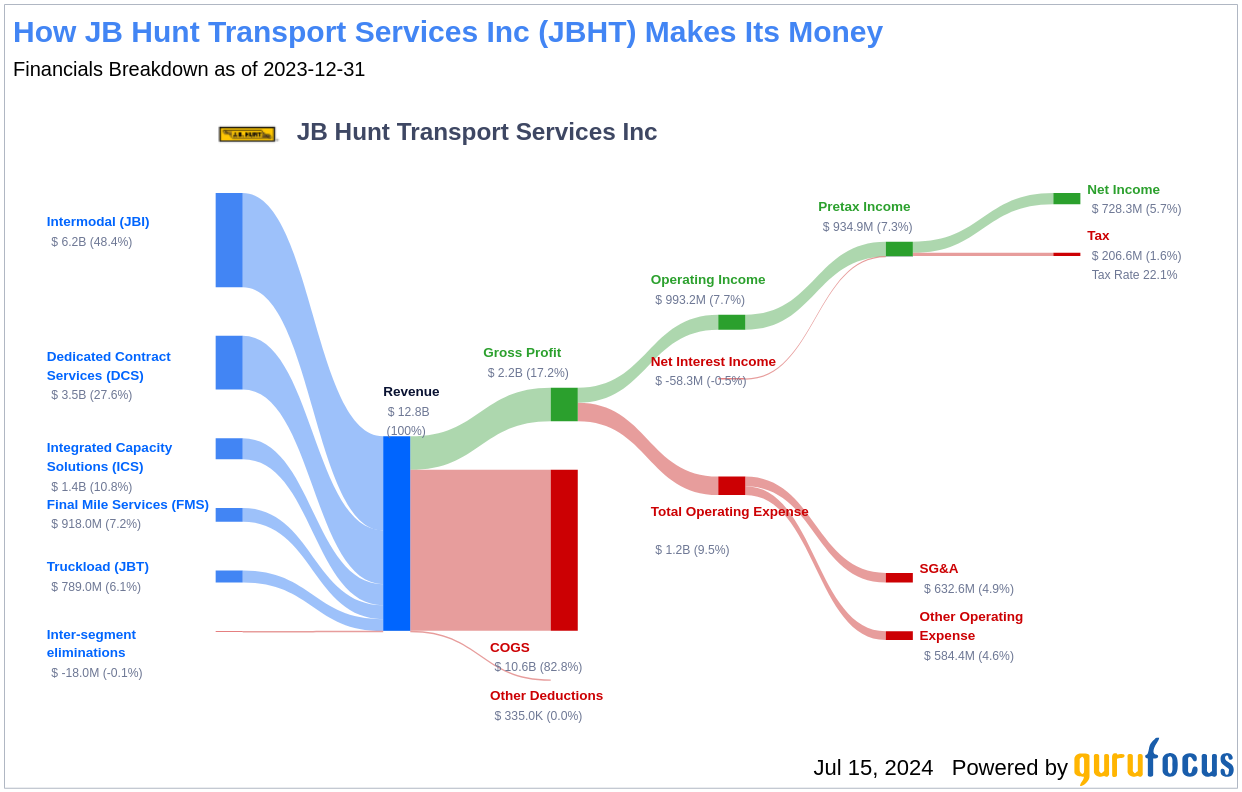
JB Hunt Transport Services Inc, with a market cap of $17.65 billion and annual sales of $12.54 billion, is a leading player in North America's surface transportation sector. The company operates through various segments, including intermodal delivery, dedicated trucking services, for-hire truckload, heavy goods final-mile delivery, and asset-light truck brokerage. These diverse operations contribute to a robust operating margin of 7.26%, showcasing the company's efficiency and strategic market positioning.
Financial Strength and Stability
JB Hunt Transport Services Inc's financial strength is evident through its impressive Interest Coverage ratio of 13.63, significantly above the benchmark set by investing legend Benjamin Graham. Additionally, its Altman Z-Score of 5.49 indicates a strong defense against financial distress, and a Debt-to-Revenue ratio of 0.11 further solidifies its financial health.
Profitability and Growth Metrics
JB Hunt's profitability is highlighted by its increasing Gross Margin, which has consistently risen over the past five years, reaching 17.23% in 2023. The company's Predictability Rank of 4.5 stars reflects its stable operational performance. In terms of growth, JB Hunt has demonstrated a strong commitment to expansion, with a notable 3-Year Revenue Growth Rate of 10.8%, outperforming over half of its industry peers.

Conclusion
Considering JB Hunt Transport Services Inc's robust financial strength, impressive profitability, and consistent growth metrics, the GF Score underscores the company's strong position for potential market outperformance. Investors looking for similar opportunities can explore more companies with strong GF Scores using the GF Score Screen.
This article, generated by GuruFocus, is designed to provide general insights and is not tailored financial advice. Our commentary is rooted in historical data and analyst projections, utilizing an impartial methodology, and is not intended to serve as specific investment guidance. It does not formulate a recommendation to purchase or divest any stock and does not consider individual investment objectives or financial circumstances. Our objective is to deliver long-term, fundamental data-driven analysis. Be aware that our analysis might not incorporate the most recent, price-sensitive company announcements or qualitative information. GuruFocus holds no position in the stocks mentioned herein.