
Long-established in the Vehicles & Parts industry, Ford Motor Co (F, Financial) has enjoyed a stellar reputation. It has recently witnessed a daily gain of 1.9%, juxtaposed with a three-month change of 24%. However, fresh insights from the GF Score hint at potential headwinds. Notably, its diminished rankings in financial strength, growth, and valuation suggest that the company might not live up to its historical performance. Join us as we dive deep into these pivotal metrics to unravel the evolving narrative of Ford Motor Co.
What Is the GF Score?
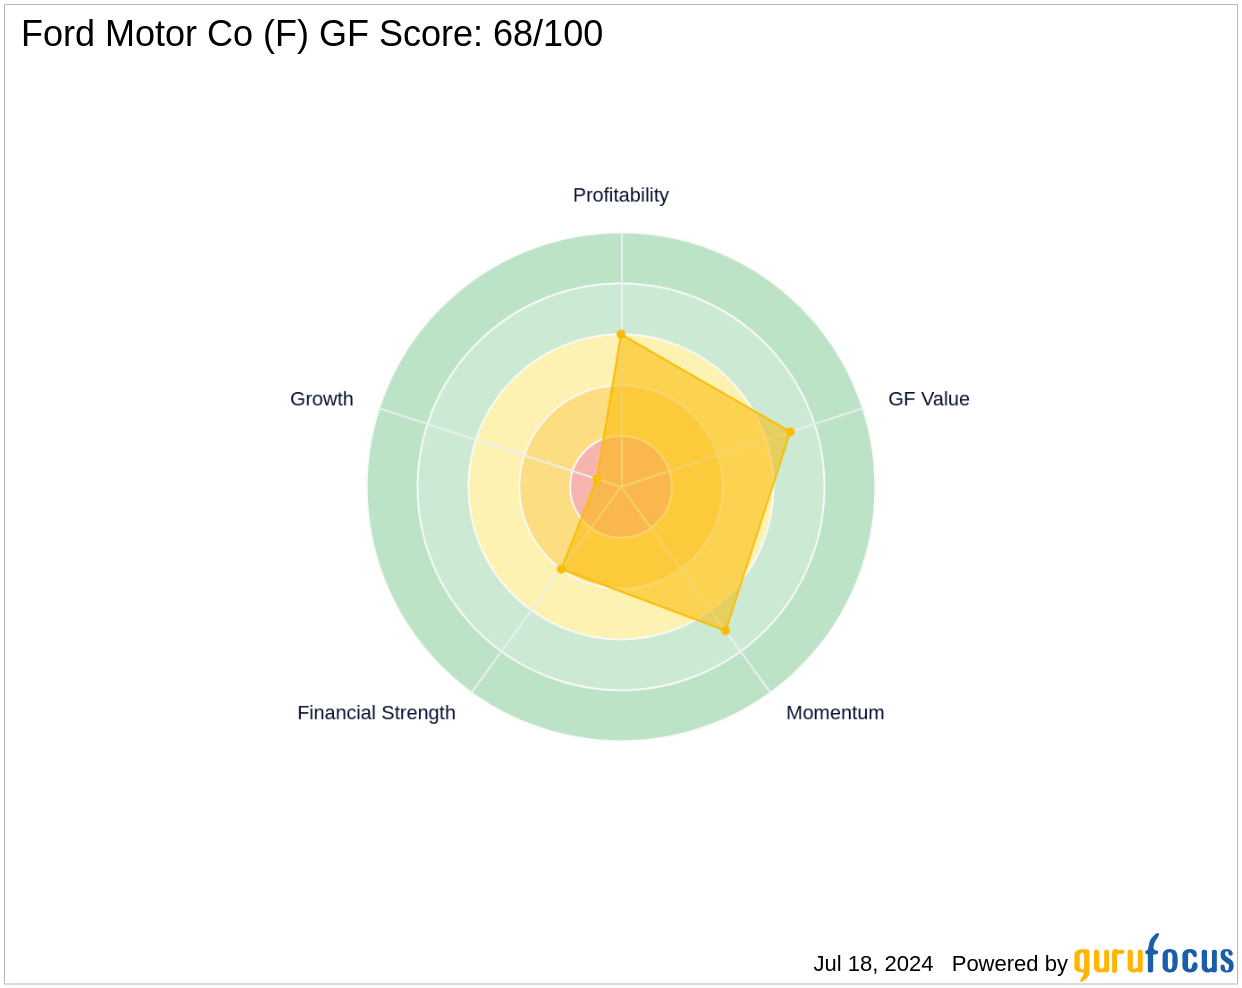
The GF Score is a stock performance ranking system developed by GuruFocus using five aspects of valuation, which has been found to be closely correlated to the long-term performances of stocks by backtesting from 2006 to 2021. The stocks with a higher GF Score generally generate higher returns than those with a lower GF Score. Therefore, when picking stocks, investors should invest in companies with high GF Scores. The GF Score ranges from 0 to 100, with 100 as the highest rank.
- Financial strength rank: 4/10
- Profitability rank: 6/10
- Growth rank: 1/10
- GF Value rank: 7/10
- Momentum rank: 7/10
Based on the above method, GuruFocus assigned Ford Motor Co a GF Score of 68 out of 100, which signals poor future outperformance potential.
Understanding Ford Motor Co Business
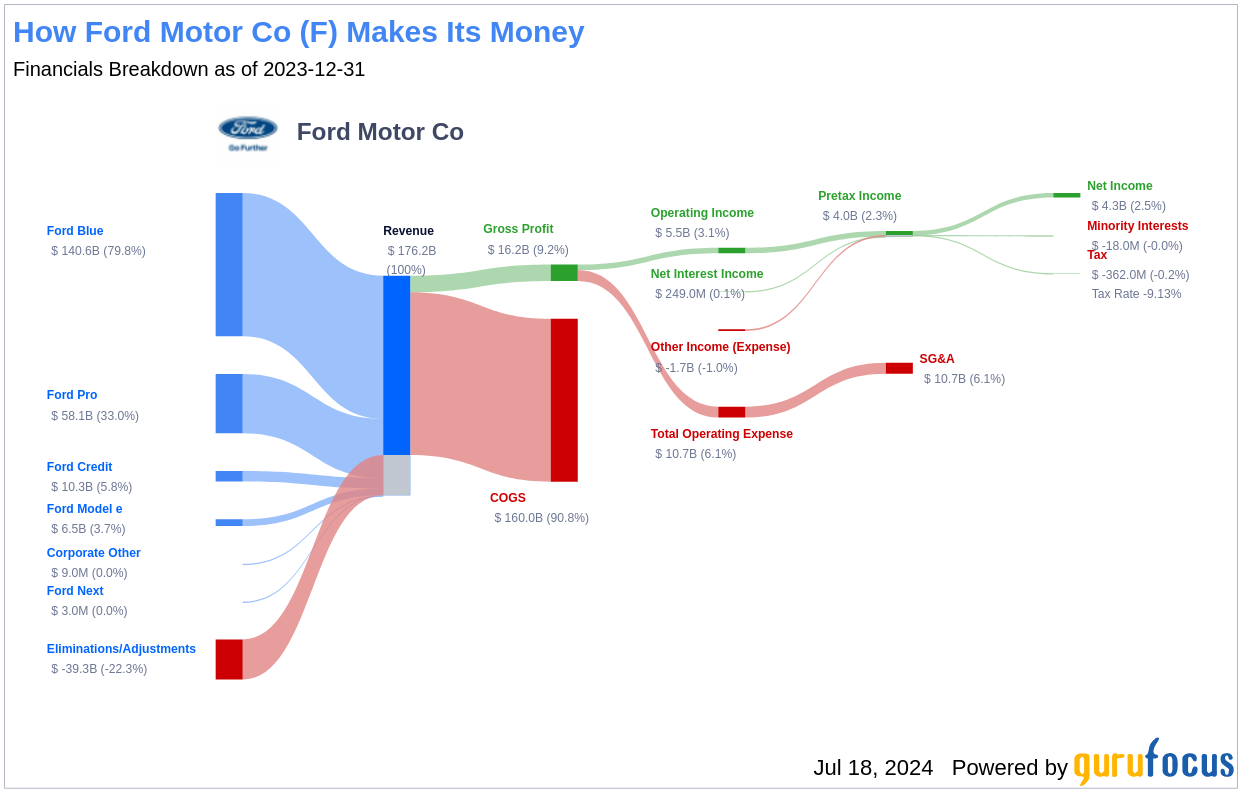
Ford Motor Co. manufactures automobiles under its Ford and Lincoln brands. In March 2022, the company announced that it will run its combustion engine business, Ford Blue, and its BEV business, Ford Model e, as separate businesses but still all under Ford Motor. The company has nearly 13% market share in the United States, about 11% share in the U.K., and under 2% share in China including unconsolidated affiliates. Sales in the U.S. made up about 66% of 2023 total company revenue. Ford has about 177,000 employees, including about 59,000 UAW employees, and is based in Dearborn, Michigan.
Financial Strength Breakdown
Ford Motor Co's financial strength indicators present some concerning insights about the company's balance sheet health. The company's interest coverage ratio of 3.52 positions it worse than 69.36% of 1041 companies in the Vehicles & Parts industry. This ratio highlights potential challenges the company might face when handling its interest expenses on outstanding debt. Additionally, the company's low cash-to-debt ratio at 0.23 indicates a struggle in handling existing debt levels. The company's debt-to-equity ratio is 3.53, which is worse than 96.78% of 1180 companies in the Vehicles & Parts industry. Furthermore, the company's debt-to-Ebitda ratio is 13.62, significantly above the warning level of 4 suggested by Joel Tillinghast.
Growth Prospects
A lack of significant growth is another area where Ford Motor Co seems to falter, as evidenced by the company's low Growth rank. Additionally, Ford Motor Co's predictability rank is just one star out of five, adding to investor uncertainty regarding revenue and earnings consistency.
Conclusion
Considering Ford Motor Co's financial strength, profitability, and growth metrics, the GF Score highlights the firm's unparalleled position for potential underperformance. Investors seeking more robust investment opportunities may consider exploring other companies with stronger GF Scores using the following screener link: GF Score Screen.
This article, generated by GuruFocus, is designed to provide general insights and is not tailored financial advice. Our commentary is rooted in historical data and analyst projections, utilizing an impartial methodology, and is not intended to serve as specific investment guidance. It does not formulate a recommendation to purchase or divest any stock and does not consider individual investment objectives or financial circumstances. Our objective is to deliver long-term, fundamental data-driven analysis. Be aware that our analysis might not incorporate the most recent, price-sensitive company announcements or qualitative information. GuruFocus holds no position in the stocks mentioned herein.