
Salesforce Inc (CRM, Financial) has recently captured the attention of investors and financial analysts with its strong financial performance. With a current share price of $287.52, Salesforce Inc has experienced a daily gain of 1.04% and an impressive three-month growth of 11.72%. A detailed analysis, supported by the GF Score, indicates that Salesforce Inc is poised for significant growth in the foreseeable future.
What Is the GF Score?
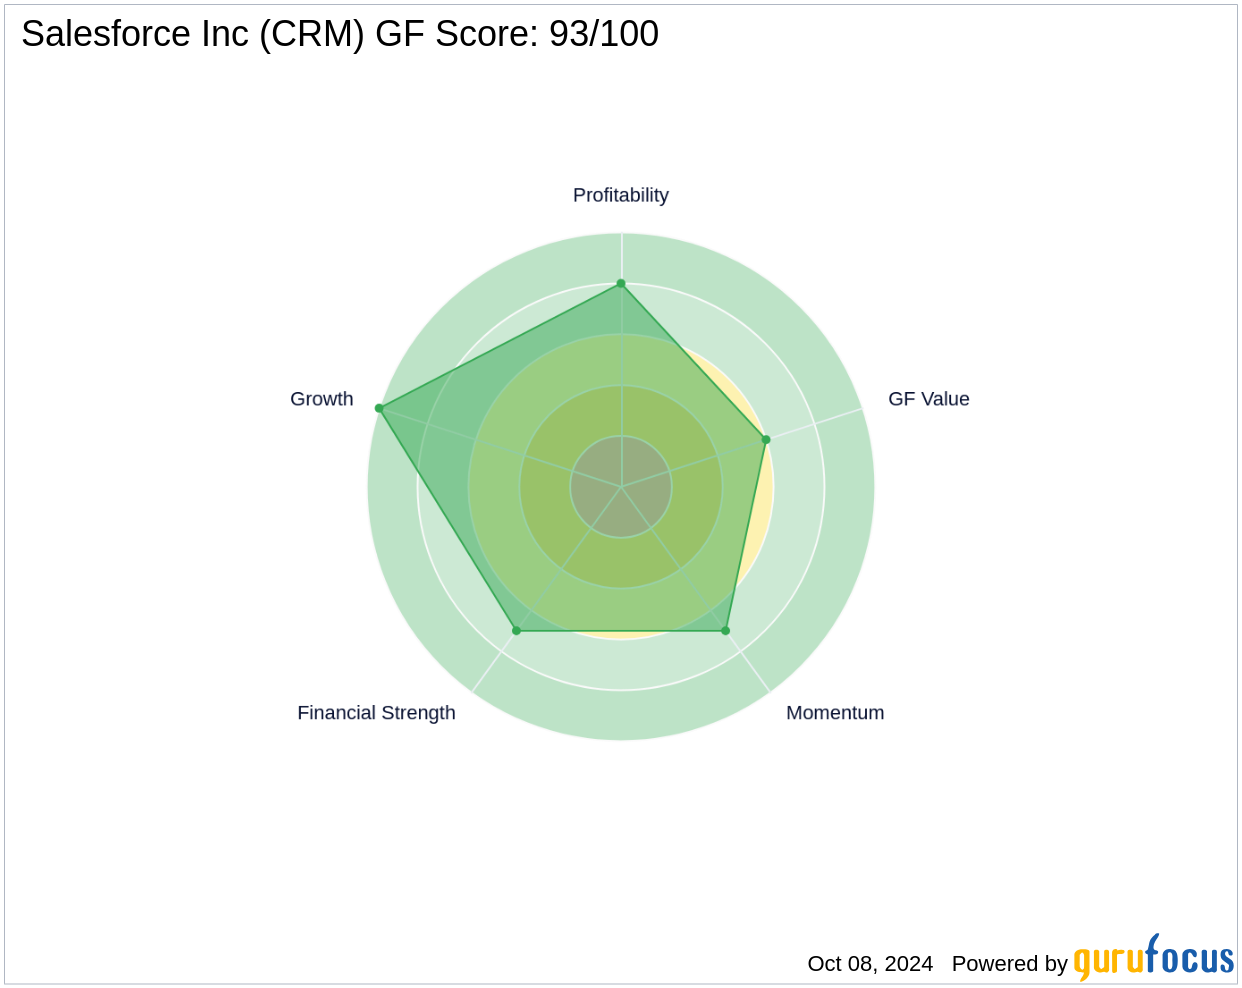
The GF Score is a proprietary stock performance ranking system developed by GuruFocus. It evaluates stocks based on five key aspects of valuation, which have shown a strong correlation with long-term stock performance from 2006 to 2021. Stocks with higher GF Scores typically yield higher returns. The GF Score ranges from 0 to 100, with 100 representing the highest potential for outperformance. Salesforce Inc boasts a GF Score of 93, indicating a strong potential for market outperformance.
- Financial strength rank: 7/10
- Profitability rank: 8/10
- Growth rank: 10/10
- GF Value rank: 6/10
- Momentum rank: 7/10
Understanding Salesforce Inc's Business
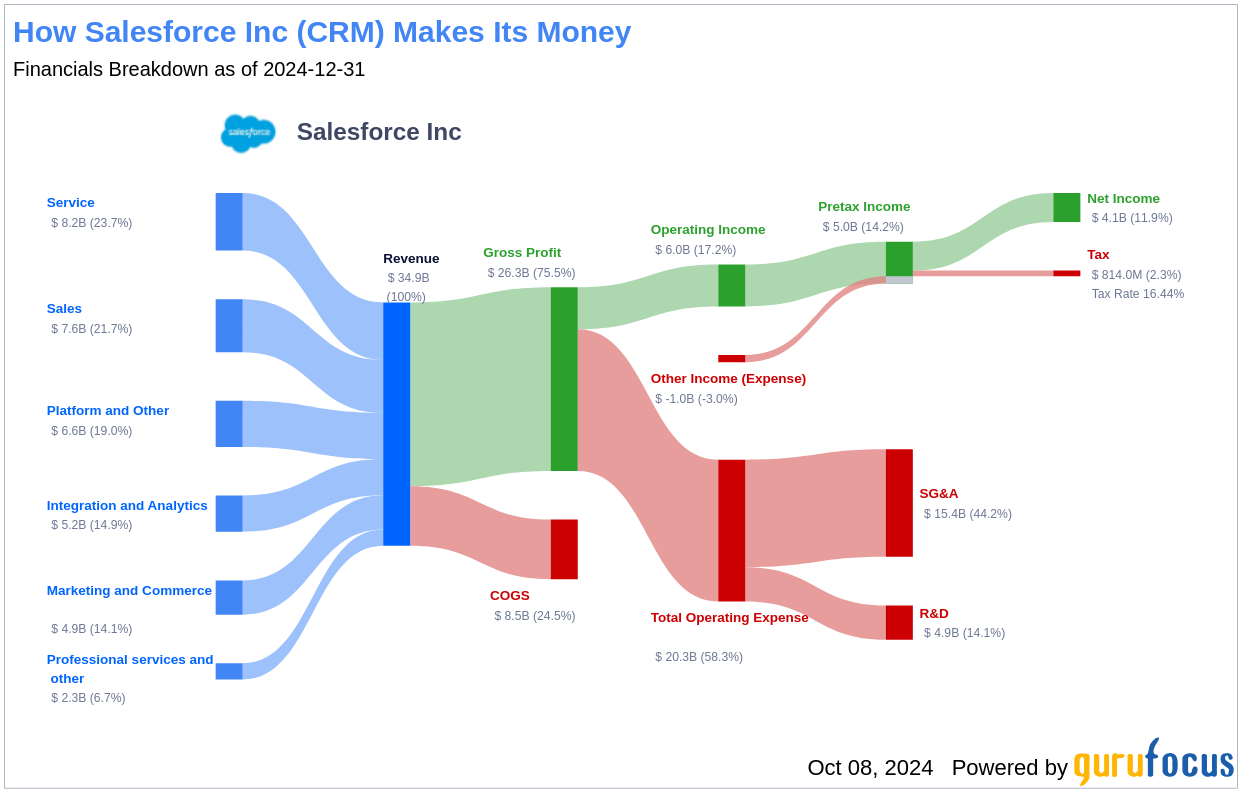
Salesforce Inc, with a market cap of $274.87 billion and annual sales of $36.47 billion, operates at the forefront of enterprise cloud computing solutions. The company's flagship Customer 360 platform integrates customer data across various systems, enhancing business operations in sales, service, marketing, and commerce. Salesforce Inc's diverse product offerings include Service Cloud, Marketing Cloud, Commerce Cloud, and the Salesforce Platform for application development, among others.
Financial Strength Breakdown
Salesforce Inc's financial resilience is reflected in its robust balance sheet and strategic debt management, with a Altman Z-Score of 5.59, indicating low risk of financial distress. The company's Debt-to-Revenue ratio stands at 0.31, underscoring its effective leverage control.
Profitability Rank Breakdown
Salesforce Inc's profitability is evidenced by its rising Operating Margin, which has significantly increased from 2.71% in 2020 to an estimated 17.21% in 2024. This trend highlights the company's enhanced efficiency in converting revenues into profits. Additionally, the Gross Margin has consistently remained above 73% over the past five years, further affirming its profitability.
Growth Rank Breakdown
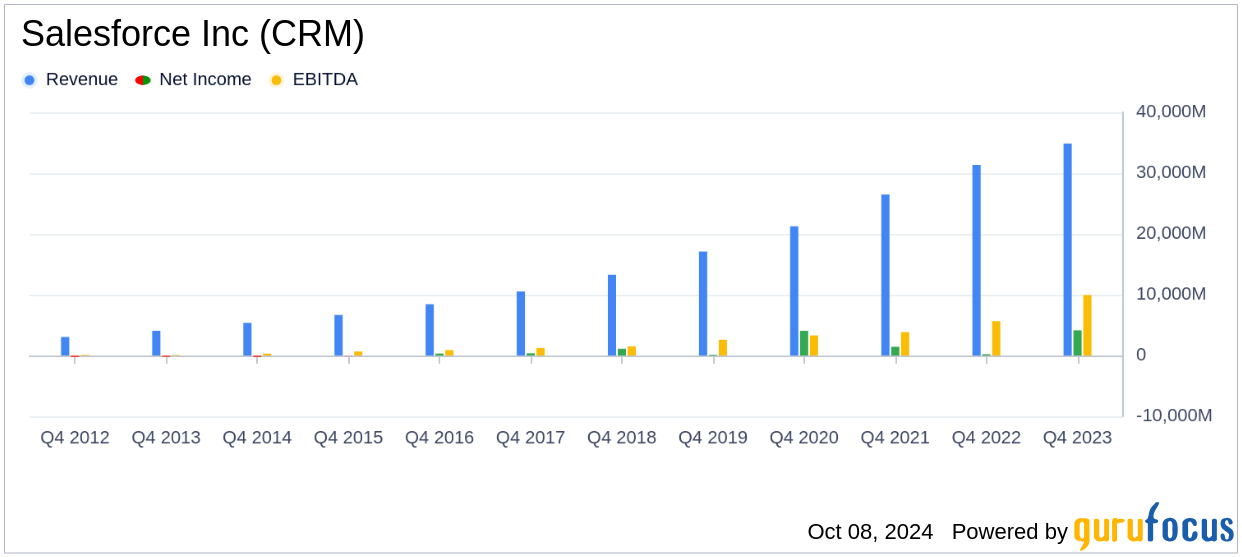
Salesforce Inc's commitment to growth is demonstrated by its Growth Rank of 10/10. The company's 3-Year Revenue Growth Rate of 15.7% surpasses 65.28% of its peers in the software industry. Moreover, its EBITDA has shown robust growth, with a three-year growth rate of 41.8%.
Conclusion
Considering Salesforce Inc's strong financial strength, impressive profitability, and consistent growth metrics, the GF Score highlights the company's exceptional position for potential market outperformance. Investors seeking similar high-potential opportunities can explore more using the GF Score Screen.
This article, generated by GuruFocus, is designed to provide general insights and is not tailored financial advice. Our commentary is rooted in historical data and analyst projections, utilizing an impartial methodology, and is not intended to serve as specific investment guidance. It does not formulate a recommendation to purchase or divest any stock and does not consider individual investment objectives or financial circumstances. Our objective is to deliver long-term, fundamental data-driven analysis. Be aware that our analysis might not incorporate the most recent, price-sensitive company announcements or qualitative information. GuruFocus holds no position in the stocks mentioned herein.