
Synopsys Inc (SNPS, Financial) has recently captured the attention of investors and financial analysts with its strong financial performance. Currently trading at $522.9 per share, Synopsys Inc has experienced a daily increase of 0.99%, despite a three-month decline of -13.74%. A detailed analysis, supported by the GF Score, indicates that Synopsys Inc is poised for significant growth in the foreseeable future.
What Is the GF Score?
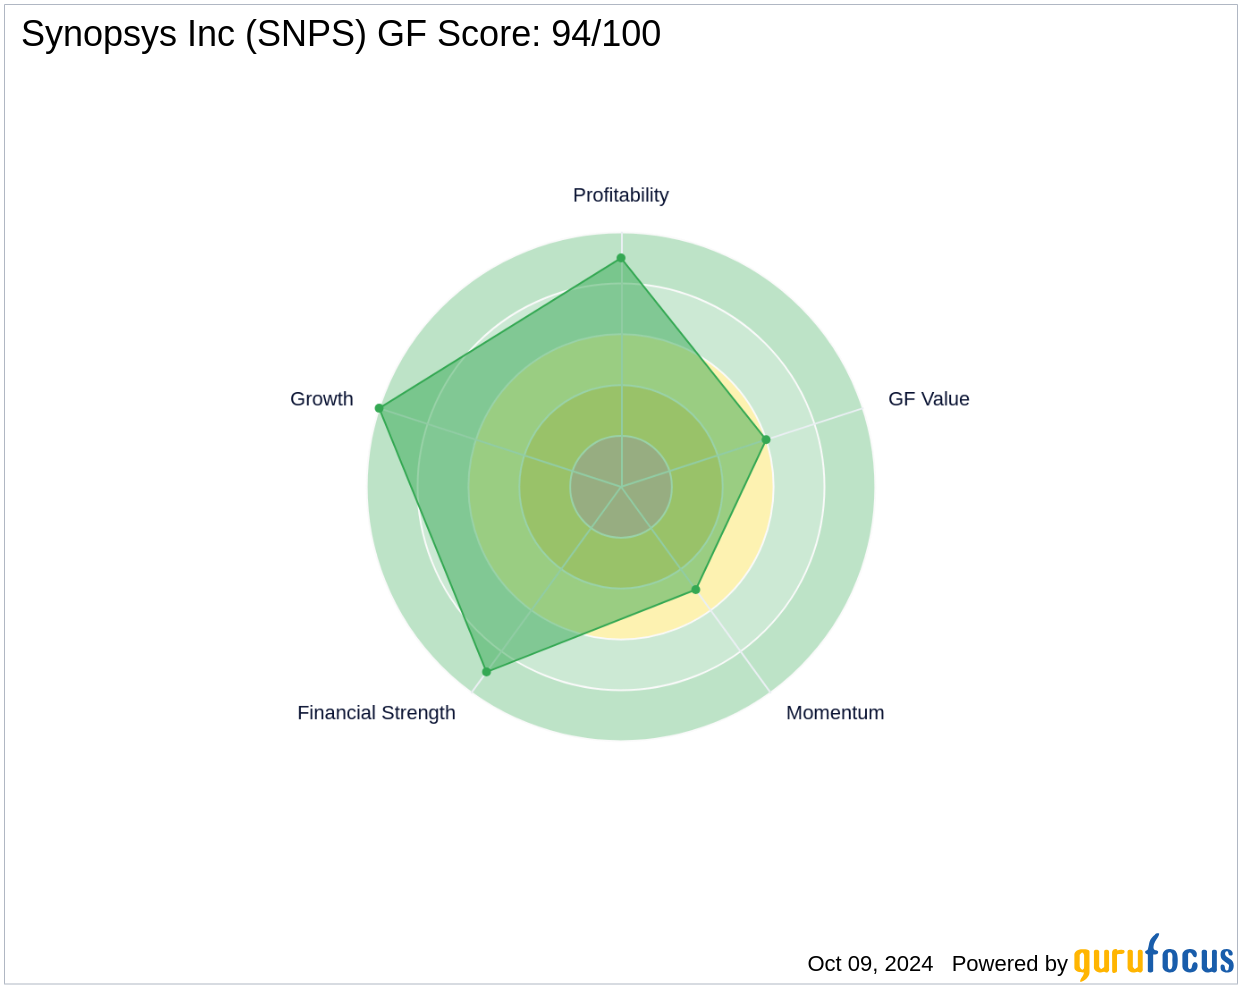
The GF Score is a proprietary stock performance ranking system developed by GuruFocus. It evaluates stocks based on five key aspects: financial strength, profitability, growth, GF Value, and momentum. These aspects are weighted differently and have been backtested from 2006 to 2021, showing a strong correlation with long-term stock performance. Stocks with higher GF Scores typically yield higher returns. Synopsys Inc boasts a GF Score of 94 out of 100, indicating a high potential for outperformance.
- Financial strength rank: 9/10
- Profitability rank: 9/10
- Growth rank: 10/10
- GF Value rank: 6/10
- Momentum rank: 5/10
Understanding Synopsys Inc's Business
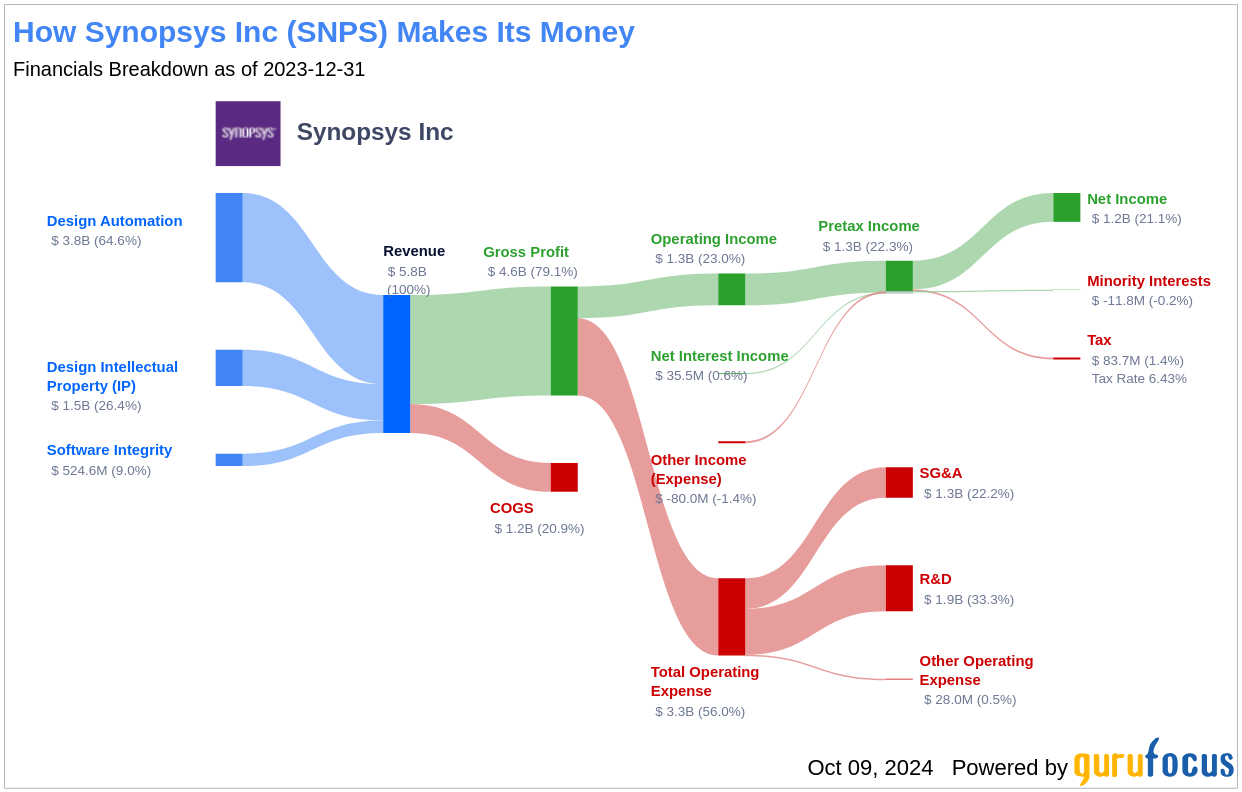
Synopsys Inc, with a market cap of $80.32 billion and annual sales of $6.62 billion, operates at a robust operating margin of 22.57%. The company is a leading provider of electronic design automation (EDA) software, intellectual property, and software integrity products. Its EDA software streamlines the chip design process, enhancing design accuracy and productivity. The growing software integrity business helps customers manage and test their code bases for security and quality. Synopsys' comprehensive portfolio benefits from the convergence of semiconductor and systems companies, expanding its customer base and benefiting from the digitalization of various end markets.
Financial Strength Breakdown
Synopsys Inc's financial strength is evident in its impressive Interest Coverage ratio of 75.99 and an Altman Z-Score of 14.46, indicating a strong buffer against financial distress. The company's strategic debt management is reflected in its low Debt-to-Revenue ratio of 0.1, underscoring its prudent financial management.
Profitability and Growth Metrics
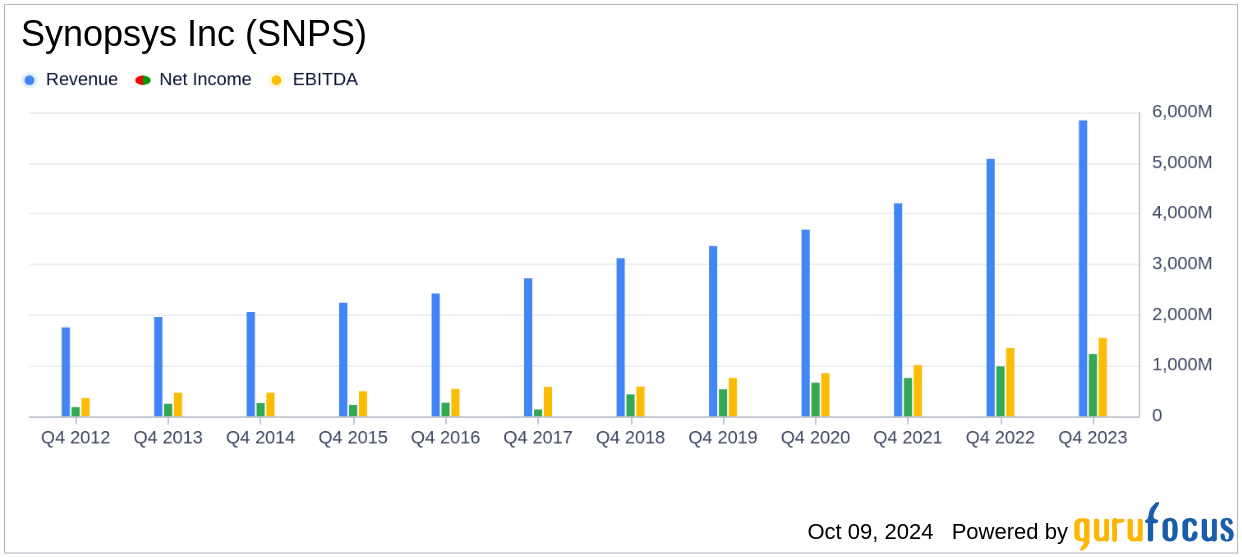
Synopsys Inc's profitability is highlighted by its increasing Operating Margin, which has grown significantly over the past five years. The company's 3-Year Revenue Growth Rate of 16.7% is notably higher than 67.65% of its peers in the software industry. This growth is complemented by a strong increase in EBITDA, emphasizing Synopsys Inc's capacity for sustained growth.
Conclusion
Considering Synopsys Inc's robust financial strength, impressive profitability, and consistent growth metrics, the GF Score highlights the company's exceptional position for potential market outperformance. Investors looking for similar opportunities can explore other high-performing companies using the GF Score Screen.
This article, generated by GuruFocus, is designed to provide general insights and is not tailored financial advice. Our commentary is rooted in historical data and analyst projections, utilizing an impartial methodology, and is not intended to serve as specific investment guidance. It does not formulate a recommendation to purchase or divest any stock and does not consider individual investment objectives or financial circumstances. Our objective is to deliver long-term, fundamental data-driven analysis. Be aware that our analysis might not incorporate the most recent, price-sensitive company announcements or qualitative information. GuruFocus holds no position in the stocks mentioned herein.