
On December 31, 2024, BlackRock, Inc. (Trades, Portfolio) executed a significant transaction by acquiring an additional 1,173,514 shares of Xencor Inc. at a trade price of $22.98 per share. This move highlights BlackRock's strategic interest in the biopharmaceutical sector, particularly in companies like Xencor that focus on innovative medical solutions. The transaction resulted in a 10.64% increase in BlackRock's holdings of Xencor, bringing the total to 12,201,617 shares. This represents 17.40% of BlackRock's holdings in Xencor Inc., indicating a substantial commitment to the company's future prospects.
BlackRock, Inc. (Trades, Portfolio): A Leading Investment Firm
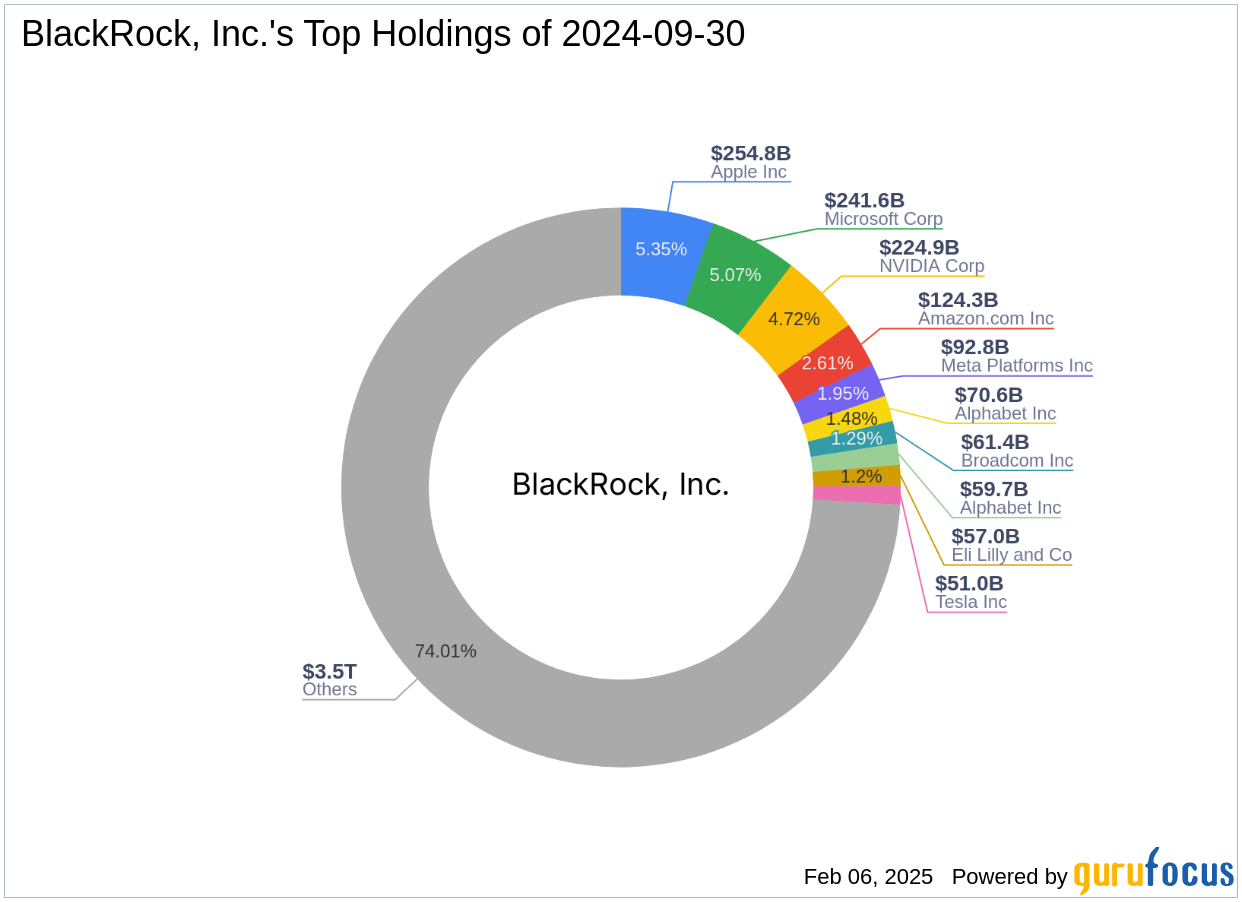
BlackRock, Inc. (Trades, Portfolio), headquartered at 50 Hudson Yards, New York, NY, is a prominent investment firm known for its vast equity of $4,761.16 trillion. The firm has a strong focus on the technology and financial services sectors, with top holdings in major companies such as Apple Inc. (AAPL, Financial), Amazon.com Inc. (AMZN, Financial), Meta Platforms Inc. (META, Financial), Microsoft Corp. (MSFT, Financial), and NVIDIA Corp. (NVDA, Financial). BlackRock's investment philosophy emphasizes long-term growth and value creation, making strategic investments in diverse sectors to maximize returns.

Xencor Inc.: A Biopharmaceutical Innovator
Xencor Inc. is a clinical-stage biopharmaceutical company based in the USA, specializing in engineered monoclonal antibodies and other protein therapeutics. The company aims to address severe and life-threatening diseases with unmet medical needs through its XmAb technology platform. Xencor's market capitalization stands at $1.23 billion, and it generates revenue from research and development collaborations, licenses, and milestone payments. Despite its innovative approach, Xencor is currently trading at $17.52, significantly overvalued with a GF Score of 61/100, indicating poor future performance potential.
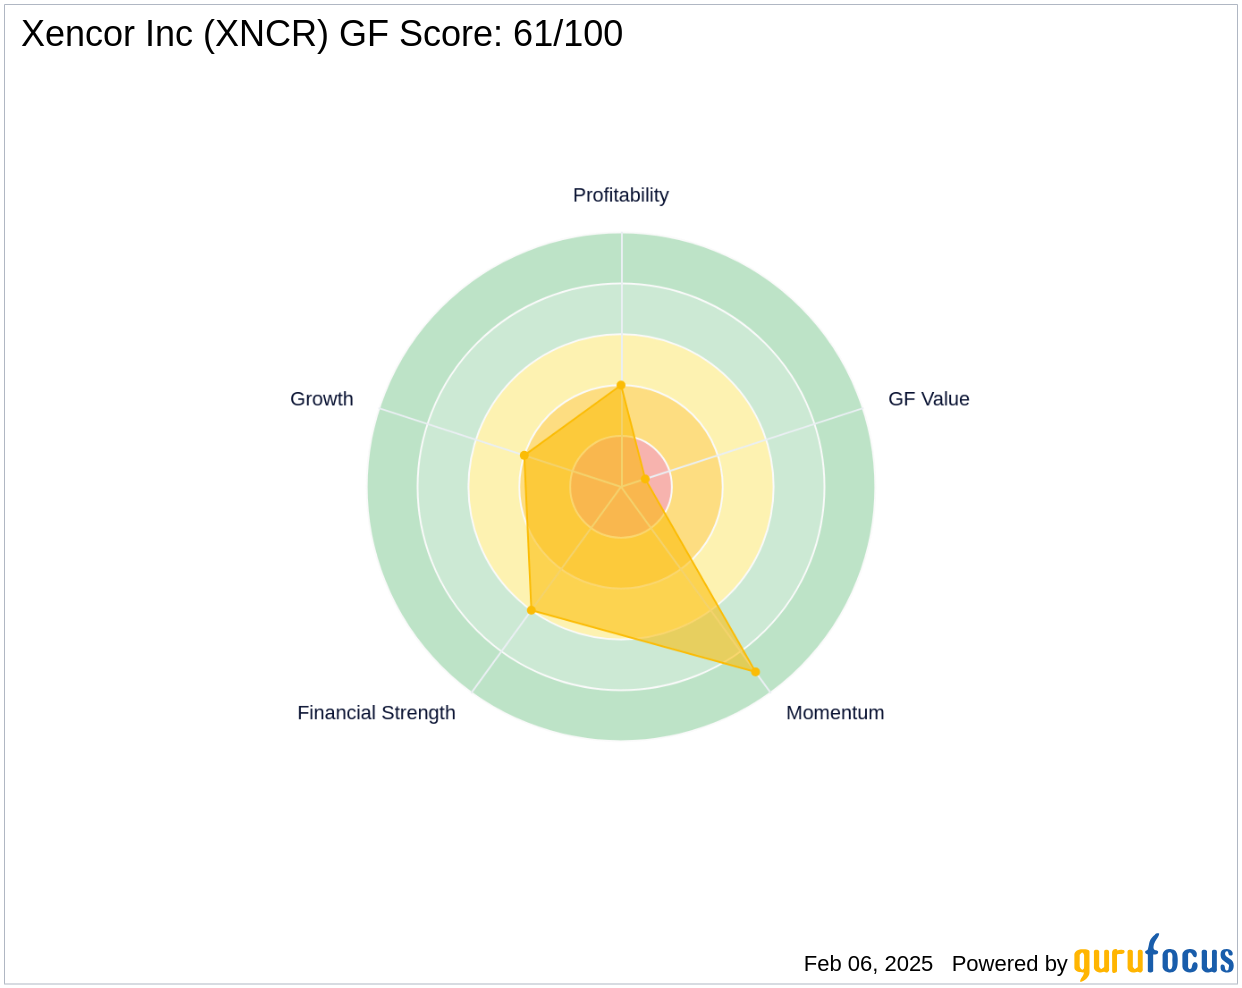
Financial Metrics and Valuation of Xencor Inc.
Xencor Inc.'s current trading price of $17.52 is notably higher than its GF Value of $8.23, suggesting it is significantly overvalued. The company's Profitability Rank is low at 4/10, and its Financial Strength is moderate with a balance sheet rank of 6/10. Xencor's negative ROE of -30.61% and ROA of -22.40% reflect financial challenges, while its revenue growth rate over three years is 9.10%. However, the company faces negative EBITDA and earnings growth, indicating potential profitability issues.
Performance and Growth Indicators
Since the transaction, Xencor Inc. has experienced a -23.76% price change, with a year-to-date change of -26.36%. Despite a three-year revenue growth rate of 9.10%, the company's negative EBITDA and earnings growth highlight ongoing financial difficulties. Xencor's Growth Rank is 4/10, and its GF Value Rank is 1/10, indicating limited growth potential and overvaluation concerns.
Risk and Profitability Analysis
Xencor Inc. faces significant financial challenges, as evidenced by its low Profitability Rank of 4/10 and negative ROE and ROA. The company's Altman Z score of 1.94 suggests potential financial distress, while its Piotroski F-Score of 2 indicates weak financial health. Despite these challenges, Xencor maintains a cash-to-debt ratio of 6.27, providing some financial stability.
Conclusion: Strategic Implications of BlackRock's Investment
BlackRock's decision to increase its stake in Xencor Inc. reflects a strategic move, despite the company's current valuation and financial metrics. This investment underscores BlackRock's confidence in Xencor's potential to innovate and deliver long-term value. However, investors should carefully consider the potential risks and rewards associated with Xencor Inc.'s future performance, given its current financial challenges and market valuation.
This article, generated by GuruFocus, is designed to provide general insights and is not tailored financial advice. Our commentary is rooted in historical data and analyst projections, utilizing an impartial methodology, and is not intended to serve as specific investment guidance. It does not formulate a recommendation to purchase or divest any stock and does not consider individual investment objectives or financial circumstances. Our objective is to deliver long-term, fundamental data-driven analysis. Be aware that our analysis might not incorporate the most recent, price-sensitive company announcements or qualitative information. GuruFocus holds no position in the stocks mentioned herein.