
O'Reilly Automotive Inc (ORLY, Financial) has recently been in the spotlight, drawing interest from investors and financial analysts due to its robust financial stance. With shares currently priced at $1,433.12, O'Reilly Automotive Inc has witnessed a daily gain of 1.74%, marked against a three-month change of 20.86%. A thorough analysis, underlined by the GF Score, suggests that O'Reilly Automotive Inc is well-positioned for substantial growth in the near future.
What Is the GF Score?
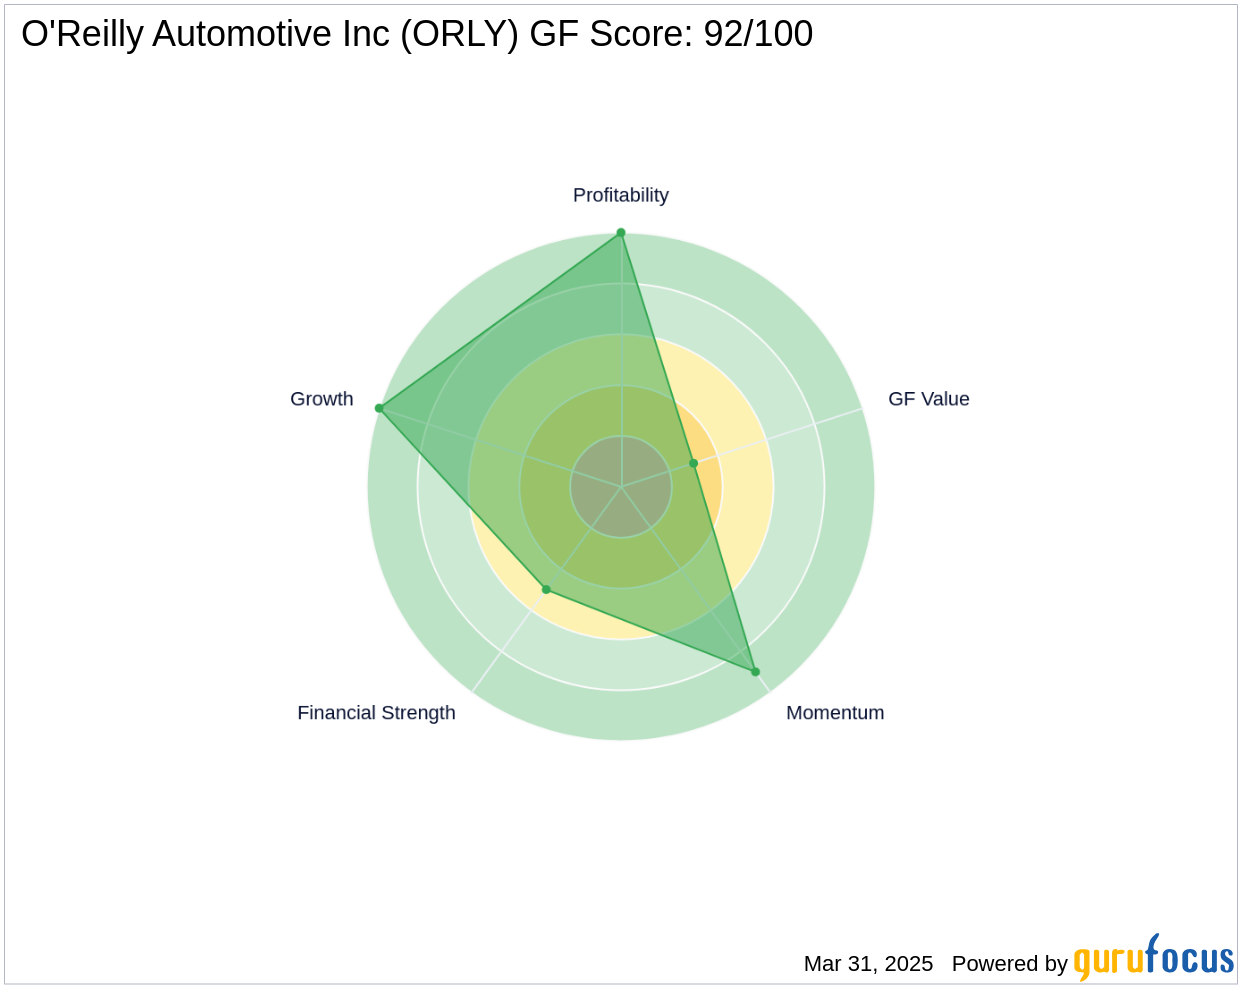
The GF Score is a stock performance ranking system developed by GuruFocus using five aspects of valuation, which has been found to be closely correlated to the long-term performances of stocks by backtesting from 2006 to 2021. The stocks with a higher GF Score generally generate higher returns than those with a lower GF Score. Therefore, when picking stocks, investors should invest in companies with high GF Scores. The GF Score ranges from 0 to 100, with 100 as the highest rank.
- Financial strength rank: 5/10
- Profitability rank: 10/10
- Growth rank: 10/10
- GF Value rank: 3/10
- Momentum rank: 9/10
Each one of these components is ranked and the ranks also have positive correlation with the long-term performances of stocks. The GF score is calculated using the five key aspects of analysis. Through backtesting, we know that each of these key aspects has a different impact on the stock price performance. Thus, they are weighted differently when calculating the total score. With a high GF Score of 92 out of 100, O'Reilly Automotive Inc signals the highest outperformance potential.
Understanding O'Reilly Automotive Inc Business
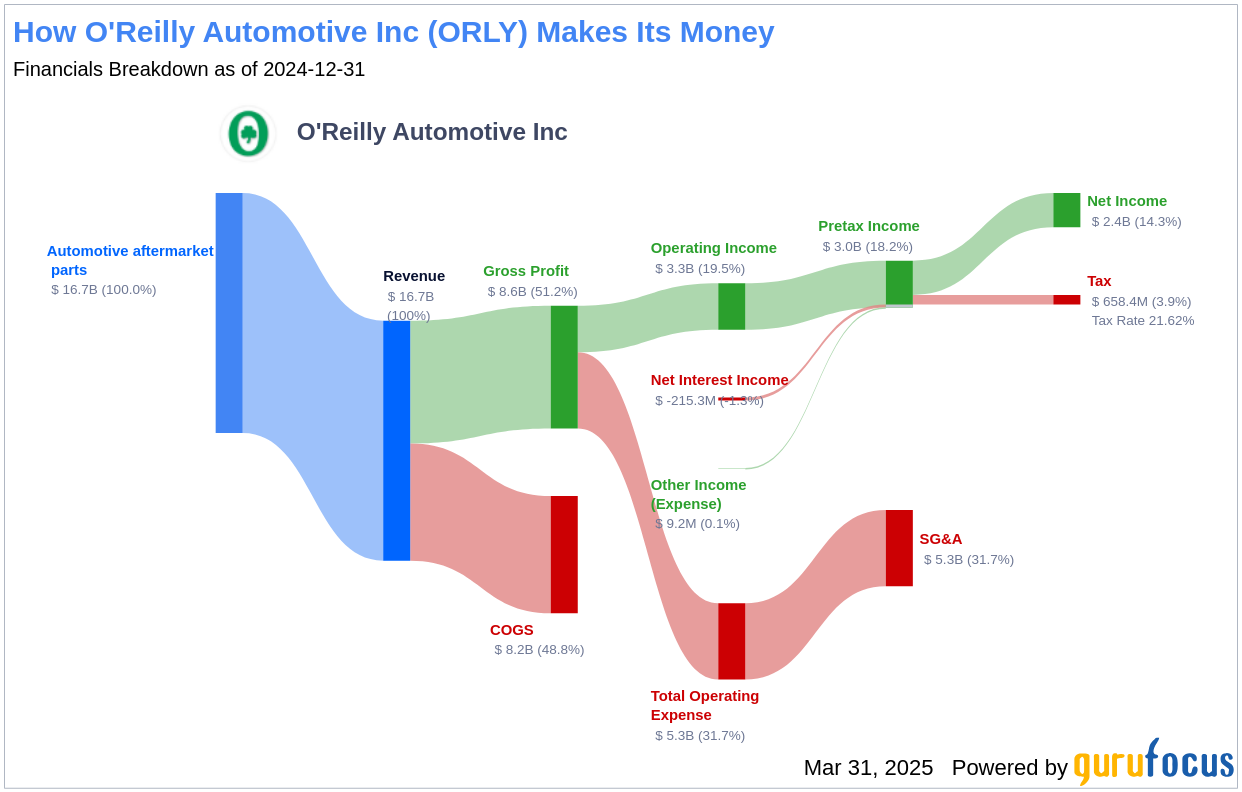
O'Reilly Automotive Inc is an aftermarket automotive parts retailer in the United States and Mexico with more than $16 billion in annual sales. The company operates over 6,000 domestic stores and serves both the do-it-yourself (about 50% of sales) and professional (47% of sales) end markets. Despite operating amid a highly fragmented industry, O'Reilly differentiates itself by providing quality service to its customers throughout the entirety of the vehicle diagnosis and purchasing process. Furthermore, the firm boasts an impressive hub-and-spoke distribution network designed to provide its localized store base with ample aftermarket part availability across a variety of vehicle makes and models.
Profitability Rank Breakdown
The Profitability Rank shows O'Reilly Automotive Inc's impressive standing among its peers in generating profit. O'Reilly Automotive Inc's strong Predictability Rank of 5.0 stars out of five underscores its consistent operational performance, providing investors with increased confidence.
Growth Rank Breakdown
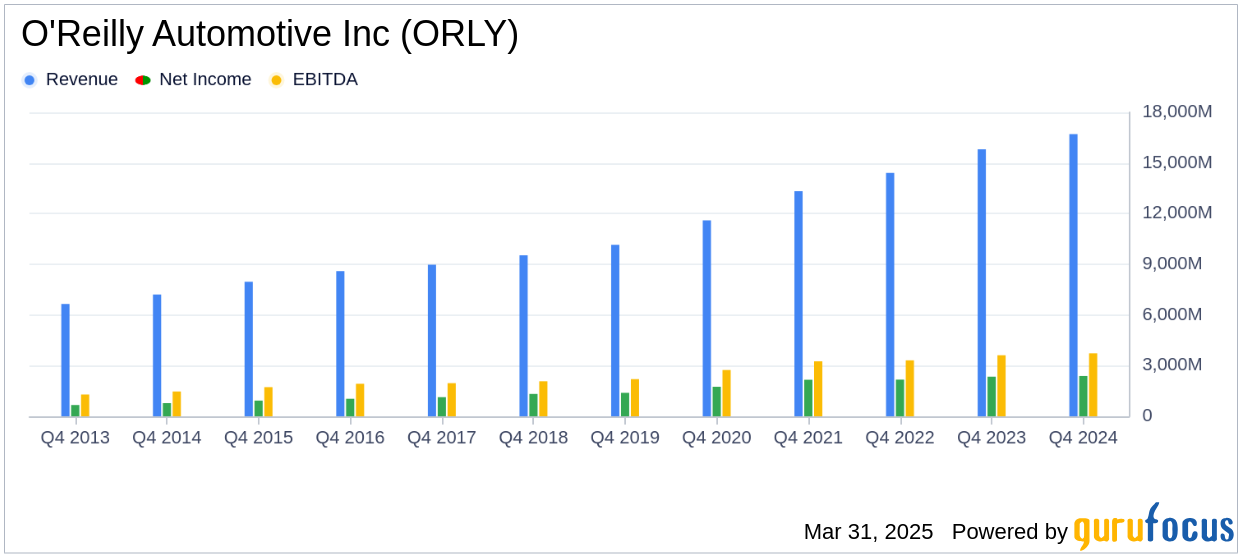
Ranked highly in Growth, O'Reilly Automotive Inc demonstrates a strong commitment to expanding its business. The company's 3-Year Revenue Growth Rate is 14.1%, which outperforms better than 72.47% of 1,057 companies in the Retail - Cyclical industry. Moreover, O'Reilly Automotive Inc has seen a robust increase in its earnings before interest, taxes, depreciation, and amortization (EBITDA) over the past few years. Specifically, the three-year growth rate stands at 10.8, and the rate over the past five years is 17.2. This trend accentuates the company's continued capability to drive growth.
Conclusion
O'Reilly Automotive Inc's financial strength, profitability, and growth metrics, as highlighted by the GF Score, underscore the firm's unparalleled position for potential outperformance. With a strong market presence and a strategic approach to growth, O'Reilly Automotive Inc is poised to continue its trajectory of success. For investors seeking companies with robust financial health and growth potential, O'Reilly Automotive Inc presents a compelling case. GuruFocus Premium members can find more companies with strong GF Scores using the following screener link: GF Score Screen.
This article, generated by GuruFocus, is designed to provide general insights and is not tailored financial advice. Our commentary is rooted in historical data and analyst projections, utilizing an impartial methodology, and is not intended to serve as specific investment guidance. It does not formulate a recommendation to purchase or divest any stock and does not consider individual investment objectives or financial circumstances. Our objective is to deliver long-term, fundamental data-driven analysis. Be aware that our analysis might not incorporate the most recent, price-sensitive company announcements or qualitative information. GuruFocus holds no position in the stocks mentioned herein.