

Bank of America has reduced its price target for Texas Instruments (TXN, Financial) from $220 to $176 while maintaining a Neutral rating on the stock. This adjustment reflects growing concerns over the impact of tariffs on U.S. chip manufacturers.
The financial institution anticipates that first-quarter results for these companies could exceed initial forecasts, as earlier projections were likely conservative. Additionally, a tariff-induced increase in demand may have temporarily boosted the market environment. However, the outlook is tempered by potential tariff-related complications.
In a scenario where tariffs are deemed "modest," Texas Instruments and its peers might face an average sales decline of 4% to 6%. In a more severe situation, described as "dire," sales could fall by approximately 9% to 12% in 2025 and 2026.
Moreover, earnings per share (EPS) may suffer in these scenarios, with declines estimated at 12% to 13% under modest tariff conditions. These projections have led to downward revisions across the semiconductor sector, highlighting the increasing uncertainty affecting the industry.
Wall Street Analysts Forecast
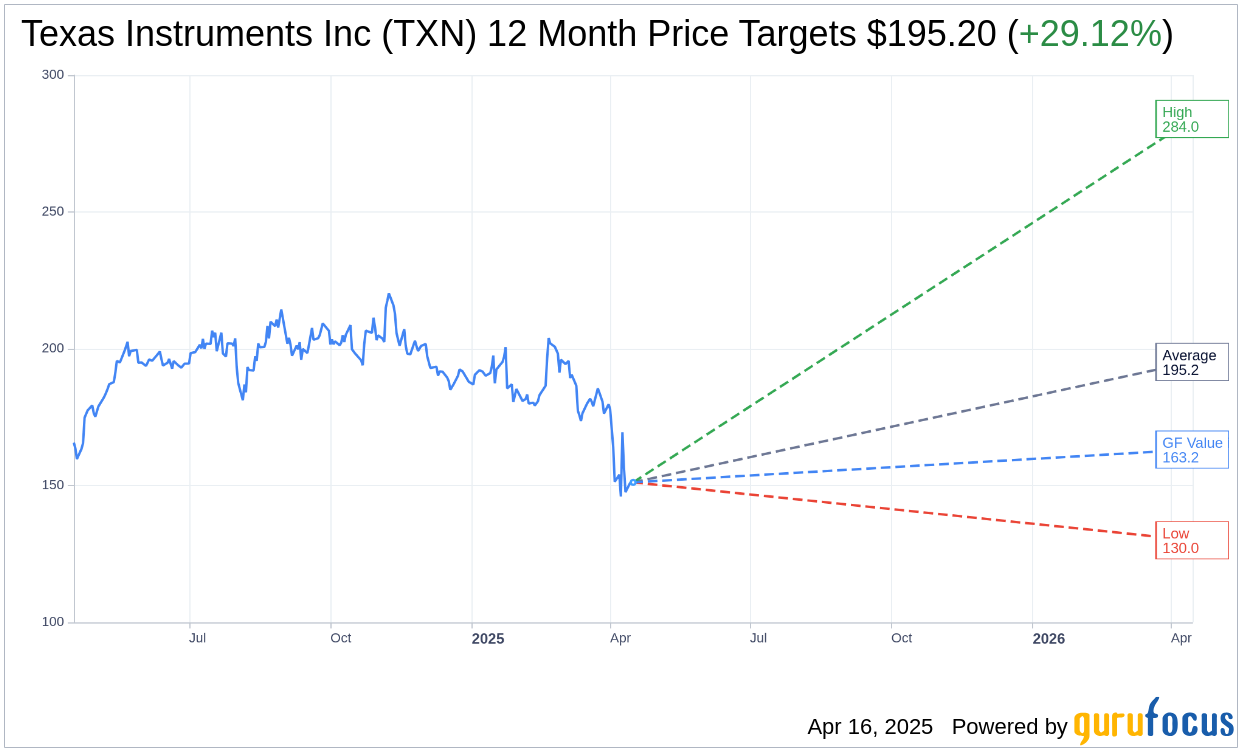
Based on the one-year price targets offered by 27 analysts, the average target price for Texas Instruments Inc (TXN, Financial) is $195.20 with a high estimate of $284.00 and a low estimate of $130.00. The average target implies an upside of 29.12% from the current price of $151.18. More detailed estimate data can be found on the Texas Instruments Inc (TXN) Forecast page.
Based on the consensus recommendation from 36 brokerage firms, Texas Instruments Inc's (TXN, Financial) average brokerage recommendation is currently 2.8, indicating "Hold" status. The rating scale ranges from 1 to 5, where 1 signifies Strong Buy, and 5 denotes Sell.
Based on GuruFocus estimates, the estimated GF Value for Texas Instruments Inc (TXN, Financial) in one year is $163.16, suggesting a upside of 7.92% from the current price of $151.18. GF Value is GuruFocus' estimate of the fair value that the stock should be traded at. It is calculated based on the historical multiples the stock has traded at previously, as well as past business growth and the future estimates of the business' performance. More detailed data can be found on the Texas Instruments Inc (TXN) Summary page.