

ManpowerGroup (MAN, Financial) has reported first-quarter revenue of $4.1 billion, surpassing the market consensus of $3.96 billion. This performance highlights the company's successful operations in various regions, notably Latin America and Asia Pacific, despite facing tougher conditions in Europe and North America.
Looking ahead, however, the company expressed caution as the demand outlook has grown uncertain following recent developments in trade policies. Despite these challenges, ManpowerGroup remains committed to staying competitive by maintaining strong relationships with clients and candidates and adjusting their costs to align with market conditions.
For the upcoming second quarter, ManpowerGroup projects diluted earnings per share to be in the range of $0.65 to $0.75. This forecast includes an anticipated benefit from currency fluctuations, estimated at an additional $0.03 per share, and a projected effective tax rate of 46.5%.
Wall Street Analysts Forecast
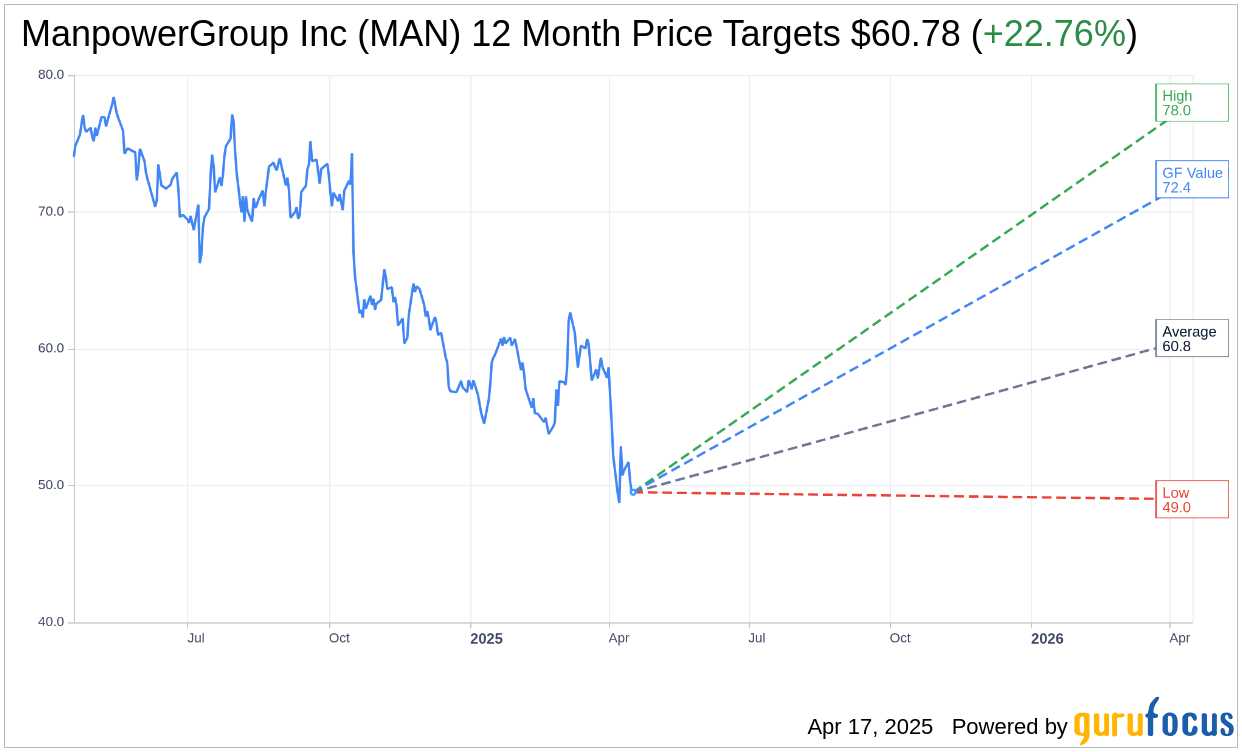
Based on the one-year price targets offered by 9 analysts, the average target price for ManpowerGroup Inc (MAN, Financial) is $60.78 with a high estimate of $78.00 and a low estimate of $49.00. The average target implies an upside of 22.76% from the current price of $49.51. More detailed estimate data can be found on the ManpowerGroup Inc (MAN) Forecast page.
Based on the consensus recommendation from 13 brokerage firms, ManpowerGroup Inc's (MAN, Financial) average brokerage recommendation is currently 2.8, indicating "Hold" status. The rating scale ranges from 1 to 5, where 1 signifies Strong Buy, and 5 denotes Sell.
Based on GuruFocus estimates, the estimated GF Value for ManpowerGroup Inc (MAN, Financial) in one year is $72.39, suggesting a upside of 46.21% from the current price of $49.51. GF Value is GuruFocus' estimate of the fair value that the stock should be traded at. It is calculated based on the historical multiples the stock has traded at previously, as well as past business growth and the future estimates of the business' performance. More detailed data can be found on the ManpowerGroup Inc (MAN) Summary page.