

Chart Industries (GTLS, Financial) has announced its first-quarter revenue for 2025, reaching $1 billion, aligning with market expectations. The company experienced impressive growth in both orders and organic sales, increasing by 17.3% and 6.6%, respectively, compared to previous periods. This quarter marks the fourth consecutive one where the reported gross profit margin surpassed 33%, which played a vital role in the 190 basis points rise in the adjusted operating income margin.
The company remains dedicated to reducing its debt and aims to achieve a net leverage ratio below 2.5 by 2025. This financial target is backed by the anticipated annual free cash flow exceeding $550 million.
Wall Street Analysts Forecast
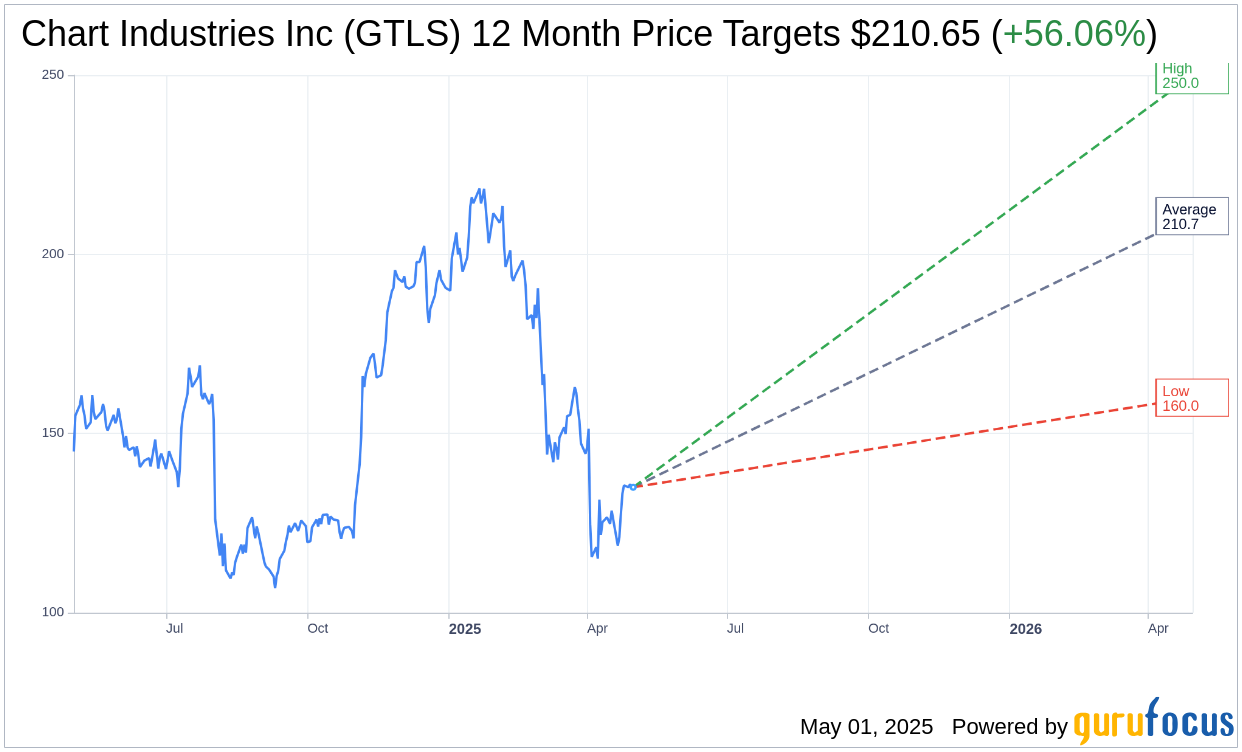
Based on the one-year price targets offered by 20 analysts, the average target price for Chart Industries Inc (GTLS, Financial) is $210.65 with a high estimate of $250.00 and a low estimate of $160.00. The average target implies an upside of 56.06% from the current price of $134.98. More detailed estimate data can be found on the Chart Industries Inc (GTLS) Forecast page.
Based on the consensus recommendation from 21 brokerage firms, Chart Industries Inc's (GTLS, Financial) average brokerage recommendation is currently 2.0, indicating "Outperform" status. The rating scale ranges from 1 to 5, where 1 signifies Strong Buy, and 5 denotes Sell.
Based on GuruFocus estimates, the estimated GF Value for Chart Industries Inc (GTLS, Financial) in one year is $313.60, suggesting a upside of 132.33% from the current price of $134.98. GF Value is GuruFocus' estimate of the fair value that the stock should be traded at. It is calculated based on the historical multiples the stock has traded at previously, as well as past business growth and the future estimates of the business' performance. More detailed data can be found on the Chart Industries Inc (GTLS) Summary page.
GTLS Key Business Developments
Release Date: February 28, 2025
- Net Cash from Operating Activities: $281.5 million in Q4 2024.
- Free Cash Flow: $261 million in Q4 2024; $388 million for full year 2024.
- Net Leverage Ratio: 2.8x at year-end 2024.
- Orders: $1.55 billion in Q4 2024, a 29.4% increase from Q4 2023; $5 billion for full year 2024, a 13% increase from 2023.
- Sales: $1.11 billion in Q4 2024, a 10.8% increase excluding FX; $4.16 billion for full year 2024, a 17.5% organic increase.
- Adjusted Operating Income: $243.4 million in Q4 2024, with a 22% margin.
- Gross Margin: 33.6% in Q4 2024.
- Adjusted EBITDA: $283.6 million in Q4 2024, 25.6% of sales; $1.014 billion for full year 2024, 24.4% of sales.
- Adjusted Diluted EPS: $2.66 in Q4 2024.
- CapEx: $20.5 million in Q4 2024; expected to be approximately $110 million for 2025.
- Net Working Capital: Improved to 13.4% of trailing 12-month sales.
- Segment Performance: Record orders and sales in Heat Transfer Systems and Specialty Products in Q4 2024.
- Repair, Service, and Leasing (RSL) Orders: $369 million in Q4 2024, a 14.2% increase from Q4 2023.
- Commercial Pipeline: Approximately $24 billion in opportunities not yet in backlog.
For the complete transcript of the earnings call, please refer to the full earnings call transcript.
Positive Points
- Chart Industries Inc (GTLS, Financial) reported a significant increase in orders, with a 29.4% rise in the fourth quarter of 2024 compared to the same period in 2023.
- The company achieved a record full-year adjusted EBITDA of $1.014 billion, representing a 24.4% margin and a year-over-year increase of 330 basis points.
- Chart Industries Inc (GTLS) successfully reduced its net leverage ratio to 2.8x by the end of 2024, making progress towards its target range of 2x to 2.5x.
- The company reported strong performance in its Heat Transfer Systems segment, with record orders and sales driven by LNG projects.
- Chart Industries Inc (GTLS) has a robust commercial pipeline with approximately $24 billion in opportunities not yet in backlog, indicating strong future growth potential.
Negative Points
- The company faced a $17 million headwind from foreign exchange in the fourth quarter of 2024, impacting sales.
- Fourth-quarter 2024 adjusted diluted earnings per share of $2.66 were negatively affected by foreign exchange, tax rate changes, share count fluctuations, and interest expenses, resulting in a $0.33 headwind.
- Cryo Tank Solutions orders decreased by 11.9% in the fourth quarter of 2024 compared to the same period in 2023, primarily due to softer European industrial gas demand.
- Specialty Products segment reported a decrease in gross profit margin by 120 basis points in the fourth quarter of 2024 compared to the previous year, due to specific third-party expenses and inefficiencies.
- The company anticipates potential negative impacts from foreign exchange in 2025, which could have an approximately 2% negative impact on sales.