

- Garrett Motion Inc. (GTX, Financial) reports a 6% increase in gasoline turbo sales, driving net sales to $878 million in Q1 2025.
- Wall Street analysts predict a 21.70% upside potential, with a price target of $12.00.
- GuruFocus calculates a GF Value of $3.44, suggesting a 65.11% downside from the current stock price.
Garrett Motion Inc. (GTX) has shown robust performance in the first quarter of 2025, achieving net sales of $878 million. This success stems from a significant 6% increase in gasoline turbo sales, a remarkable achievement given the existing market challenges. The company's Adjusted EBIT stands at $131 million, which translates to a commendable 14.9% margin. Moreover, Garrett Motion is forging ahead with new partnerships in turbocharged electric vehicle (EV) and hybrid models across key regions like China and North America, indicating a strategic move towards greener automotive technologies.
Wall Street Analysts' Insights
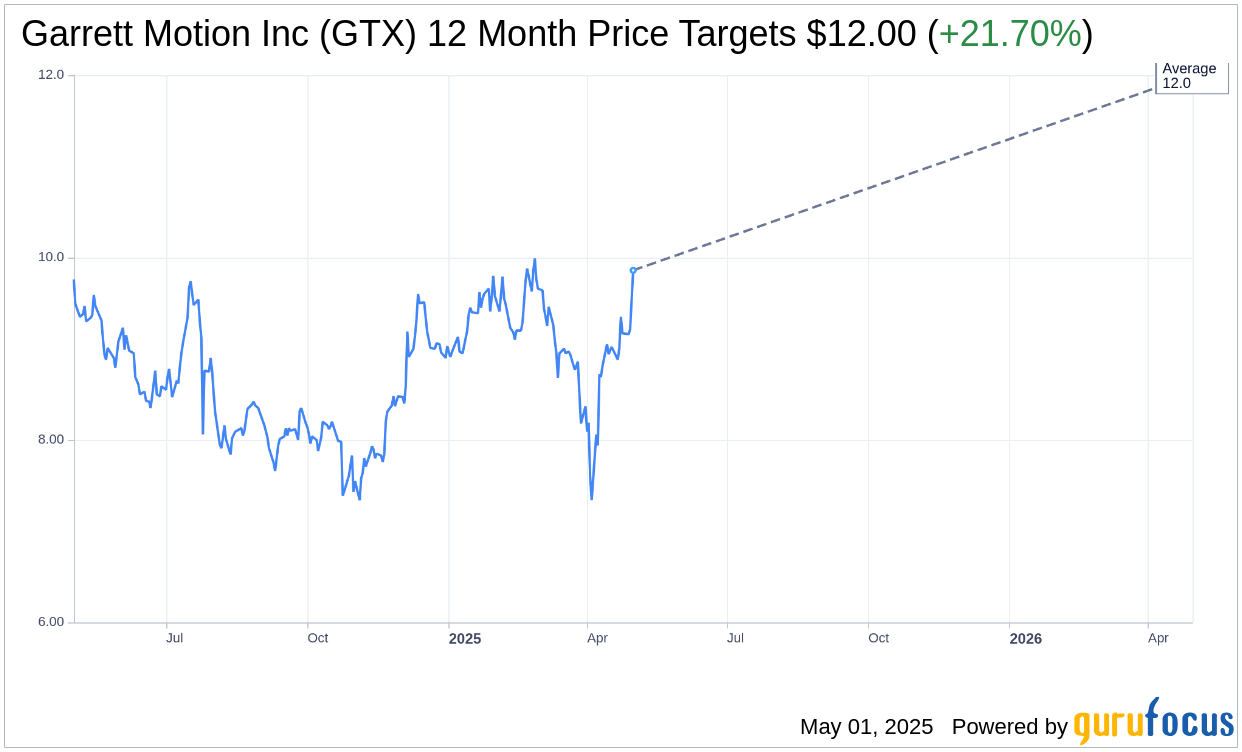
Analysts have set a one-year price target for Garrett Motion Inc. (GTX, Financial) at an average of $12.00, with both the high and low estimates at $12.00. This target suggests a promising upside of 21.70% from its current price of $9.86. Investors seeking more comprehensive forecast details can visit the Garrett Motion Inc (GTX) Forecast page.
The consensus recommendation from a single brokerage firm rates Garrett Motion Inc. (GTX, Financial) at 2.0, denoting an "Outperform" status. This rating is part of a five-point scale, where 1 is a Strong Buy, and 5 is a Sell, underscoring a positive outlook towards the company's performance.
GF Value and Investment Considerations
Conversely, the GF Value estimation from GuruFocus presents a different perspective. It estimates the one-year GF Value for Garrett Motion Inc. (GTX, Financial) to be $3.44, indicating a potential downside of 65.11% from the prevailing price of $9.86. This figure represents GuruFocus's calculation of the stock's fair value, drawing from historical trading multiples, past business growth, and future business performance predictions. For investors looking for an in-depth analysis, the Garrett Motion Inc (GTX) Summary page offers extensive data.