

Interface, under the ticker TILE, anticipates an adjusted gross profit margin of 37.2% for the second quarter, based on net sales. The company is optimistic about delivering a solid performance throughout the year, despite the challenges posed by a fluctuating global economic landscape and heightened macroeconomic uncertainties.
Wall Street Analysts Forecast
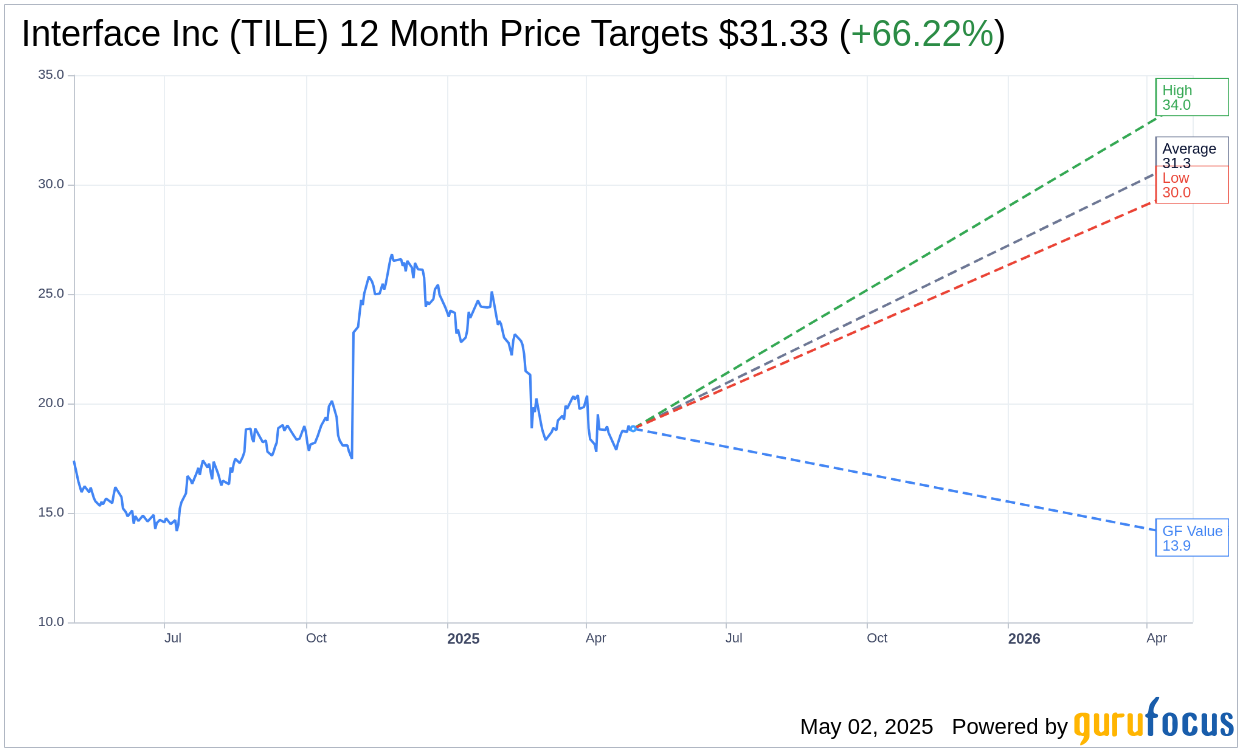
Based on the one-year price targets offered by 3 analysts, the average target price for Interface Inc (TILE, Financial) is $31.33 with a high estimate of $34.00 and a low estimate of $30.00. The average target implies an upside of 66.22% from the current price of $18.85. More detailed estimate data can be found on the Interface Inc (TILE) Forecast page.
Based on the consensus recommendation from 2 brokerage firms, Interface Inc's (TILE, Financial) average brokerage recommendation is currently 1.5, indicating "Buy" status. The rating scale ranges from 1 to 5, where 1 signifies Strong Buy, and 5 denotes Sell.
Based on GuruFocus estimates, the estimated GF Value for Interface Inc (TILE, Financial) in one year is $13.88, suggesting a downside of 26.37% from the current price of $18.85. GF Value is GuruFocus' estimate of the fair value that the stock should be traded at. It is calculated based on the historical multiples the stock has traded at previously, as well as past business growth and the future estimates of the business' performance. More detailed data can be found on the Interface Inc (TILE) Summary page.
TILE Key Business Developments
Release Date: February 25, 2025
- Fourth Quarter Net Sales: $335 million, a 3% increase versus Q4 2023.
- FX Neutral Net Sales Growth: 3.4% increase compared to Q4 2023.
- Americas FX Neutral Net Sales: Up 9.6% year over year in Q4.
- EAAA FX Neutral Net Sales: Down 5.2% year over year in Q4.
- Fourth Quarter Adjusted Gross Profit Margin: 36.9%, a decrease of 139 basis points from Q4 2023.
- Fourth Quarter Adjusted SG&A Expenses: $90.8 million, up from $83.5 million in Q4 2023.
- Fourth Quarter Adjusted Operating Income: $32.8 million, down from $41 million in Q4 2023.
- Fourth Quarter Adjusted EPS: $0.34, compared to $0.41 in Q4 2023.
- Full Year 2024 Net Sales: $1.32 billion, a 4.3% increase versus 2023.
- Full Year FX Neutral Net Sales Growth: 4.4% year over year.
- Full Year Adjusted Gross Profit Margin: 37.1%, an increase of 173 basis points from 2023.
- Full Year Adjusted Operating Income: $141.4 million, up from $116.4 million in 2023.
- Full Year Adjusted EBITDA: $189 million, compared to $162 million in 2023.
- Cash from Operating Activities: $148.4 million in 2024.
- Liquidity at Year-End: $398.5 million.
- Debt Repayment in 2024: $115.2 million.
- Net Debt at Year-End: $203.5 million.
- Net Leverage Ratio: 1.1 times.
- Capital Expenditures in 2024: $33.8 million, up from $26.1 million in 2023.
- 2025 First Quarter Net Sales Guidance: $290 million to $300 million.
- 2025 Full Year Net Sales Guidance: $1.315 billion to $1.365 billion.
For the complete transcript of the earnings call, please refer to the full earnings call transcript.
Positive Points
- Interface Inc (TILE, Financial) achieved a 4% increase in currency neutral net sales in 2024, demonstrating strong performance despite industry headwinds.
- The company's 'One Interface' strategy, which integrates NORA and Interface selling teams, resulted in double-digit order growth in the Americas.
- Investments in automation and robotics at key manufacturing plants have improved margins and operational efficiency.
- Interface Inc (TILE) received top honors in Reuters 2024 sustainability awards for its commitment to becoming carbon negative by 2040.
- The company reported a strong financial position with a net leverage ratio of 1.1 times and significant debt repayment in 2024.
Negative Points
- Currency neutral net sales in the EAAA region were down 2% due to a softer macroeconomic environment.
- The healthcare segment saw a 2% decline in global billings year-over-year, despite a 12% increase in the fourth quarter.
- Fourth quarter adjusted gross profit margin decreased by 139 basis points compared to the prior year.
- Adjusted operating income for the fourth quarter was lower than the previous year, primarily due to lower adjusted gross profit margin and higher variable compensation.
- The corporate office segment experienced a 1% decline in global billings for the year, reflecting challenges in the market.