

American Axle & Manufacturing (AXL, Financial) reported its first-quarter revenue at $1.41 billion, slightly below market expectations of $1.43 billion. This performance reflects its continued efforts in cost management and productivity enhancements, leading to a positive year-over-year operating cash flow, as noted by the company's leadership.
Despite the challenges posed by an unpredictable geopolitical trade landscape, AXL remains committed to controlling the variables within its reach. Moreover, the company is making significant strides in advancing its transformational partnership with Dowlais. This strategic focus underscores AXL's dedication to long-term growth and stability.
Wall Street Analysts Forecast
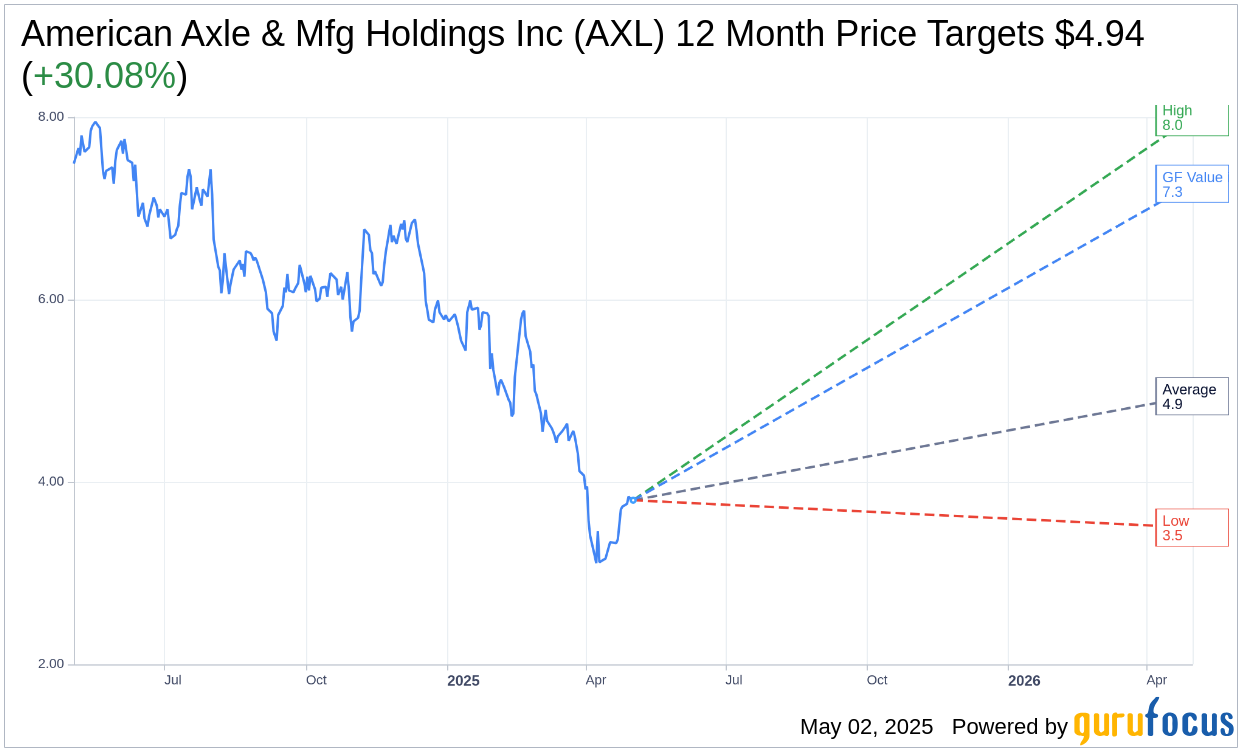
Based on the one-year price targets offered by 7 analysts, the average target price for American Axle & Mfg Holdings Inc (AXL, Financial) is $4.94 with a high estimate of $8.00 and a low estimate of $3.50. The average target implies an upside of 30.08% from the current price of $3.80. More detailed estimate data can be found on the American Axle & Mfg Holdings Inc (AXL) Forecast page.
Based on the consensus recommendation from 8 brokerage firms, American Axle & Mfg Holdings Inc's (AXL, Financial) average brokerage recommendation is currently 3.0, indicating "Hold" status. The rating scale ranges from 1 to 5, where 1 signifies Strong Buy, and 5 denotes Sell.
Based on GuruFocus estimates, the estimated GF Value for American Axle & Mfg Holdings Inc (AXL, Financial) in one year is $7.27, suggesting a upside of 91.32% from the current price of $3.8. GF Value is GuruFocus' estimate of the fair value that the stock should be traded at. It is calculated based on the historical multiples the stock has traded at previously, as well as past business growth and the future estimates of the business' performance. More detailed data can be found on the American Axle & Mfg Holdings Inc (AXL) Summary page.
AXL Key Business Developments
Release Date: February 14, 2025
- Fourth Quarter 2024 Sales: $1.4 billion.
- Full Year 2024 Sales: Approximately $6.1 billion.
- Fourth Quarter 2024 Adjusted EBITDA: $161 million or 11.6% of sales.
- Full Year 2024 Adjusted EBITDA: $749 million or 12.2% of sales.
- Fourth Quarter 2024 Adjusted EPS: Loss of $0.06 per share.
- Full Year 2024 Adjusted EPS: $0.51 per share.
- Fourth Quarter 2024 Adjusted Free Cash Flow: $79 million.
- Full Year 2024 Adjusted Free Cash Flow: $230 million.
- Fourth Quarter 2024 Gross Profit: $154.3 million.
- Fourth Quarter 2024 SG&A Expense: $89 million or 6.4% of sales.
- Fourth Quarter 2024 Net Interest Expense: $37.3 million.
- Fourth Quarter 2024 Income Tax Expense: $6.8 million.
- Fourth Quarter 2024 GAAP Net Loss: $13.7 million or $0.12 per share.
- Fourth Quarter 2024 Net Cash Provided by Operating Activities: $151.2 million.
- Fourth Quarter 2024 Capital Expenditures: $77.6 million.
- End of 2024 Net Debt: $2.1 billion.
- End of 2024 Total Available Liquidity: Approximately $1.5 billion.
- 2025 Sales Outlook: $5.8 billion to $6.05 billion.
- 2025 Adjusted EBITDA Outlook: $700 million to $760 million.
- 2025 Adjusted Free Cash Flow Outlook: $200 million to $230 million.
For the complete transcript of the earnings call, please refer to the full earnings call transcript.
Positive Points
- American Axle & Mfg Holdings Inc (AXL, Financial) closed the year strong with solid operational progress and generated $79 million in adjusted free cash flow in the fourth quarter.
- The company secured a contract extension to supply power transfer units for Ford Maverick and Bronco Sport vehicles, ensuring future business stability.
- AAM's transformational combination with Dowlais is expected to create a leading global driveline and metal forming supplier, enhancing shareholder value.
- The company achieved its financial targets for 2024, coming in at the high end of its adjusted EBITDA range and exceeding the midpoint of its adjusted free cash flow target.
- AAM's 2025 financial outlook includes targeting sales between $5.8 billion to $6.05 billion and adjusted EBITDA of approximately $700 million to $760 million, indicating a stable financial trajectory.
Negative Points
- AAM's adjusted earnings per share in the fourth quarter of 2024 was a loss of $0.06 per share, indicating profitability challenges.
- The company's sales in the fourth quarter of 2024 were $1.38 billion, down from $1.46 billion in the fourth quarter of 2023, reflecting a decline in sales volume.
- Adjusted EBITDA in the fourth quarter of 2024 decreased to $160.8 million from $169.5 million in the previous year, showing a decline in profitability.
- AAM's net debt remains high at $2.1 billion, with a net leverage ratio of 2.8x, indicating significant financial obligations.
- The company anticipates higher cash taxes in 2025, ranging from $60 million to $70 million, which could impact cash flow.