

Summary:
- Cigna (CI, Financial) sees a robust revenue increase in Q1 2025 and adjusts its full-year EPS forecast upward.
- Analysts offer an average price target suggesting potential upside for Cigna's stock.
- GuruFocus estimates indicate a significant value potential for Cigna over the next year.
Strong Financial Outlook for Cigna (CI) in Q1 2025
Cigna (CI) unveiled its impressive financial performance for the first quarter of 2025, reporting a substantial revenue of $65.5 billion. This quarter was marked by a rise in adjusted earnings per share (EPS) to $6.74, reflecting the company's strong operational capabilities. Building on this momentum, Cigna has revised its full-year EPS forecast, now expecting to reach at least $29.60.
The growth momentum is spearheaded by the company's Evernorth and Cigna Healthcare platforms, which continue to deliver exceptional results. Moreover, Cigna's strategic initiatives include new programs designed to tap into the burgeoning GLP-1 drugs market, promising further growth and profitability.
Wall Street Analysts' Expectations
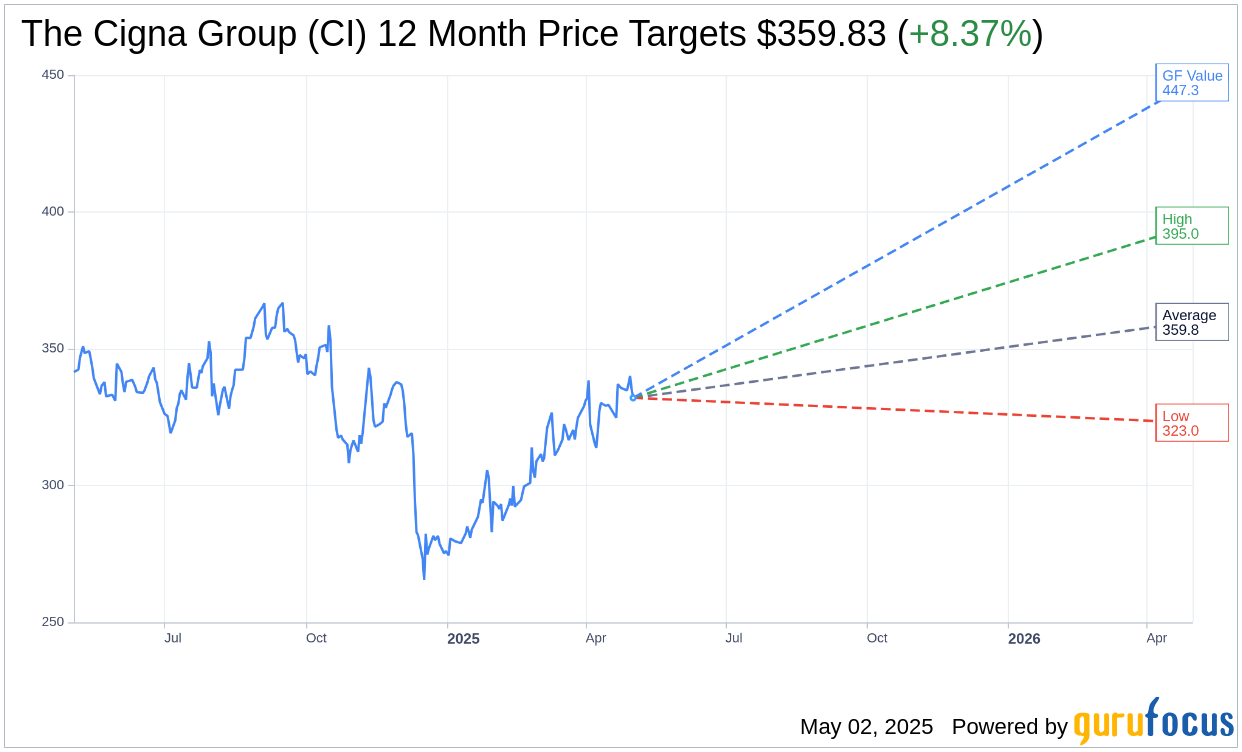
According to analyses provided by 23 experts, The Cigna Group's (CI, Financial) average one-year price target is set at $359.83. This target is supported by a high estimate of $395.00 and a low estimate of $323.00, suggesting a promising upside potential of 8.36% from its current stock price of $332.07. For more detailed insights, visit the The Cigna Group (CI) Forecast page.
Furthermore, insights from 26 brokerage firms conclude with an average brokerage recommendation of 2.0 for The Cigna Group (CI, Financial), categorizing the stock as "Outperform." This rating system ranges from 1 (Strong Buy) to 5 (Sell), positioning Cigna favorably among market options.
GuruFocus Valuation Insights
Delving into the valuation perspective, GuruFocus provides an estimated GF Value for The Cigna Group (CI, Financial) over a one-year horizon at $447.34. This estimate indicates a remarkable upside potential of 34.71% from the current trading price of $332.07. The GF Value is derived from historical trading multiples in conjunction with past business growth trends and future performance projections. Investors seeking a more comprehensive analysis can explore further data on the The Cigna Group (CI) Summary page.