

CNO Financial Group (CNO, Financial) has revealed that its Board of Directors has sanctioned a 1-cent increment in its quarterly dividend, marking its thirteenth straight year of increases. The Board has declared a quarterly cash dividend of 17 cents per share for its common stockholders. Shareholders on record as of June 10 will be eligible to receive this dividend, which is scheduled to be distributed on June 24.
Wall Street Analysts Forecast
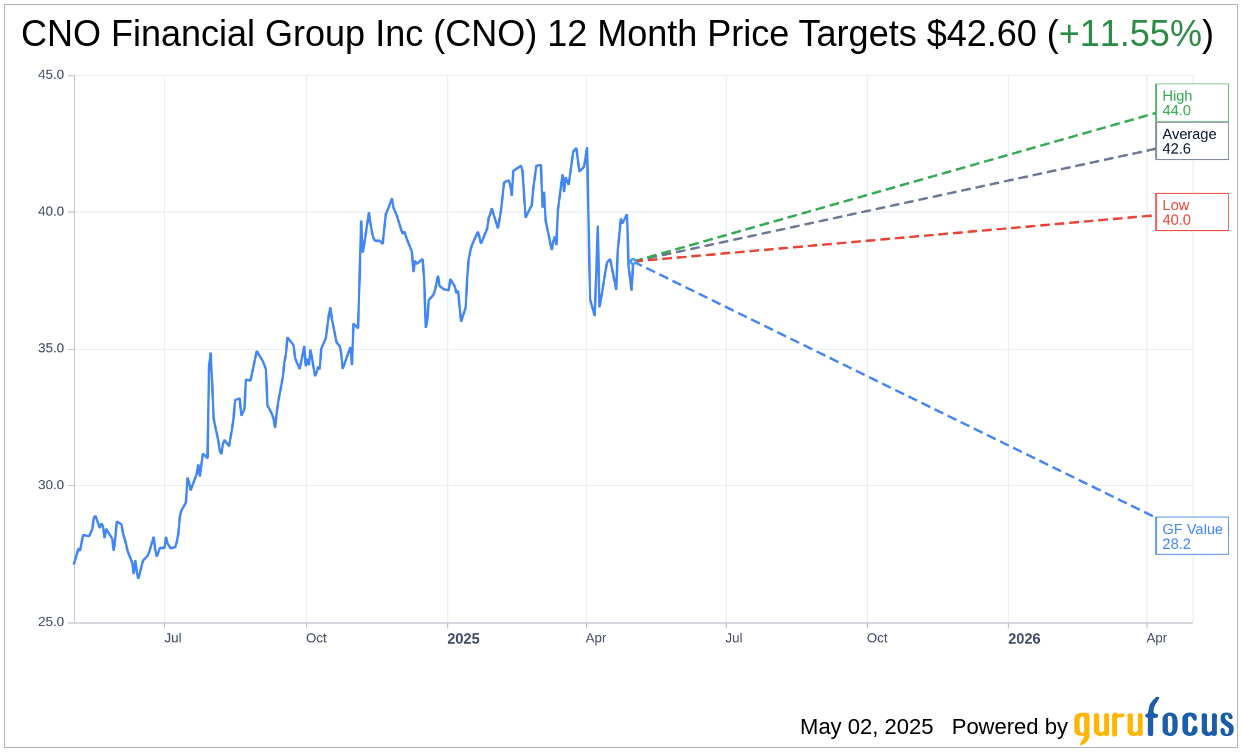
Based on the one-year price targets offered by 5 analysts, the average target price for CNO Financial Group Inc (CNO, Financial) is $42.60 with a high estimate of $44.00 and a low estimate of $40.00. The average target implies an upside of 11.55% from the current price of $38.19. More detailed estimate data can be found on the CNO Financial Group Inc (CNO) Forecast page.
Based on the consensus recommendation from 6 brokerage firms, CNO Financial Group Inc's (CNO, Financial) average brokerage recommendation is currently 3.0, indicating "Hold" status. The rating scale ranges from 1 to 5, where 1 signifies Strong Buy, and 5 denotes Sell.
Based on GuruFocus estimates, the estimated GF Value for CNO Financial Group Inc (CNO, Financial) in one year is $28.17, suggesting a downside of 26.24% from the current price of $38.19. GF Value is GuruFocus' estimate of the fair value that the stock should be traded at. It is calculated based on the historical multiples the stock has traded at previously, as well as past business growth and the future estimates of the business' performance. More detailed data can be found on the CNO Financial Group Inc (CNO) Summary page.
CNO Key Business Developments
Release Date: April 29, 2025
- Operating Earnings per Diluted Share: $0.79, up 52%; $0.74, up 42% excluding significant items.
- Book Value per Diluted Share (excluding AOCI): $37.03, up 6%.
- Annuity Collected Premiums: Up 12%.
- Account Values: Up 7%.
- Premium per Policy: Up 19%.
- Client Assets in Brokerage and Advisory: Up 16%.
- New Accounts: Up 13%.
- Average Account Size: Up 3%.
- Total Assets Entrusted by Clients: Over $16 billion, up 9%.
- Health NAP: Up 9%.
- Supplemental Health NAP: Up 8%.
- Medicare Supplement NAP: Up 24%.
- Medicare Advantage Policies: Up 42%.
- Producing Agent Count: Up 2%.
- Worksite Insurance Sales: Up 11%.
- Critical Illness Insurance: Up 37%.
- Life Insurance: Up 17%.
- Accident Insurance: Up 4%.
- NAP from New Group Clients: Up 134%.
- Producing Agent Count (Worksite Division): Up 8%.
- Agent Productivity: Up 10%.
- Operating Return on Equity (excluding significant items): 11.9% on a trailing 12-month basis.
- Insurance Product Margin: Up 8% excluding significant items.
- Net Investment Income: Up 16% for the quarter.
- New Money Rate: 6.43%.
- Average Yield on Allocated Investments: 4.87%, up 17 basis points year over year.
- Market Value of Invested Assets: Grew 11% in the quarter.
- Consolidated Risk-Based Capital Ratio: 379% at quarter end.
- Available Hold Co Liquidity: $250 million.
- Leverage: 32.7% as reported; 26.1% adjusting for senior notes to be paid off.
For the complete transcript of the earnings call, please refer to the full earnings call transcript.
Positive Points
- CNO Financial Group Inc (CNO, Financial) reported a 52% increase in operating earnings per diluted share, demonstrating strong financial performance.
- The company achieved its 11th consecutive quarter of strong sales momentum and its ninth consecutive quarter of growth in producing agent count.
- Annuity collected premiums were up 12%, marking the seventh consecutive quarter of growth, and account values increased by 7%.
- CNO Financial Group Inc (CNO) maintained a strong capital and liquidity position, returning $117 million to shareholders and achieving a book value per diluted share of $37.03, up 6%.
- The worksite division experienced a 12th consecutive quarter of growth in insurance sales, with critical illness insurance up 37% and life insurance up 17%.
Negative Points
- Visibility into macroeconomic drivers such as interest rates is deteriorating, posing potential challenges for future financial performance.
- Direct-to-consumer life sales were impacted by elevated TV advertising costs and a pullback in marketing spend, leading to lower lead volumes.
- The consumer division's long-term care app was down in the quarter due to strong comparables from the previous year.
- Fee income was adversely impacted by ASC 606 revenue recognition accounting for the sale of third-party Medicare Advantage policies, creating volatility in revenue recognition timing.
- The market value of invested assets grew, but alternative returns were still below long-term run rate expectations, indicating potential pressure on investment income.