

Investment firm TD Cowen has adjusted its price target for T. Rowe Price (TROW, Financial), increasing it slightly to $90, up from the previous target of $89. The firm continues to rate the stock as Hold. Recent developments in T. Rowe Price's strategic initiatives, particularly in enhancing global retirement solutions, active exchange-traded funds (ETFs), and fixed income strategies, have been well received. However, TD Cowen notes that the anticipated decline in the base fee rate, influenced by changes in product mix and growth in investment vehicles, may constrain both revenue and profit growth for TROW. This is expected even in the face of the company's improved expense management and increased share buybacks.
Wall Street Analysts Forecast
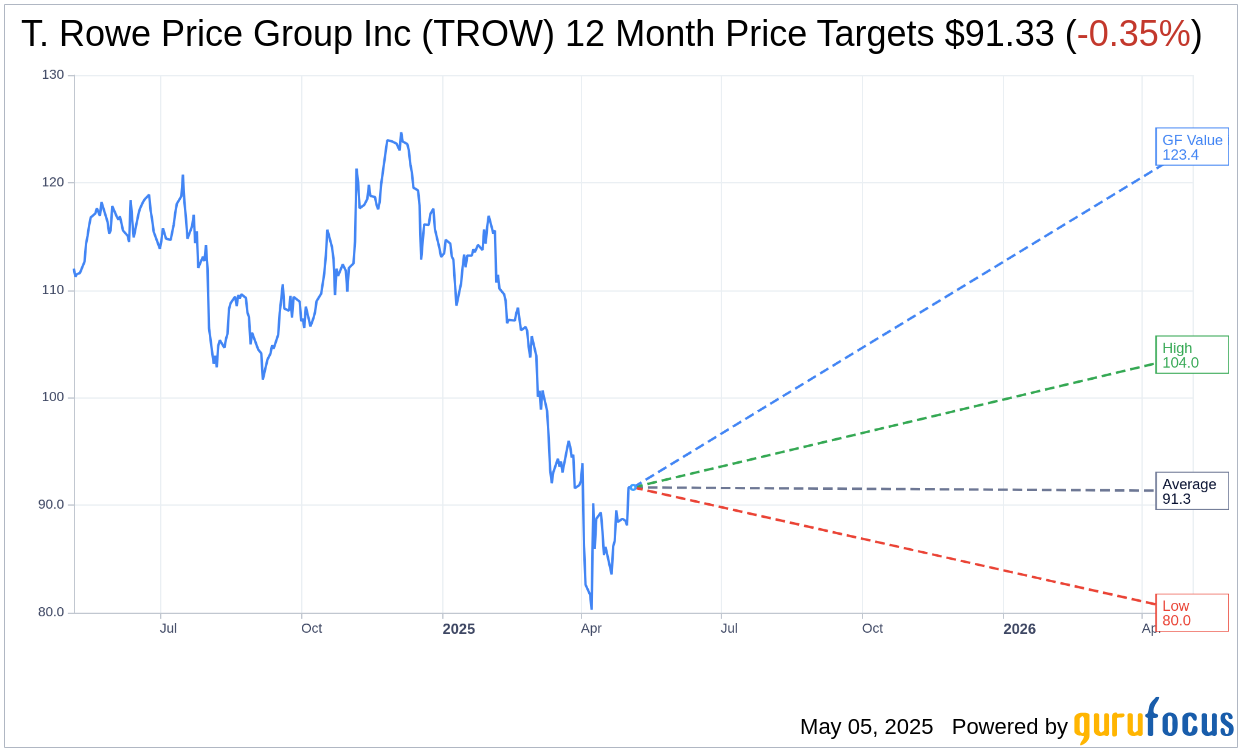
Based on the one-year price targets offered by 12 analysts, the average target price for T. Rowe Price Group Inc (TROW, Financial) is $91.33 with a high estimate of $104.00 and a low estimate of $80.00. The average target implies an downside of 0.35% from the current price of $91.65. More detailed estimate data can be found on the T. Rowe Price Group Inc (TROW) Forecast page.
Based on the consensus recommendation from 15 brokerage firms, T. Rowe Price Group Inc's (TROW, Financial) average brokerage recommendation is currently 3.3, indicating "Hold" status. The rating scale ranges from 1 to 5, where 1 signifies Strong Buy, and 5 denotes Sell.
Based on GuruFocus estimates, the estimated GF Value for T. Rowe Price Group Inc (TROW, Financial) in one year is $123.36, suggesting a upside of 34.6% from the current price of $91.65. GF Value is GuruFocus' estimate of the fair value that the stock should be traded at. It is calculated based on the historical multiples the stock has traded at previously, as well as past business growth and the future estimates of the business' performance. More detailed data can be found on the T. Rowe Price Group Inc (TROW) Summary page.
TROW Key Business Developments
Release Date: May 02, 2025
- Adjusted Earnings Per Share (EPS): $2.23 for Q1 2025, down from $2.38 in Q1 2024, but up from $2.12 in Q4 2020.
- Net Outflows: $8.6 billion, primarily driven by US equities and rebalancing.
- Target Date Franchise Net Inflows: $6.3 billion, led by blend products.
- Fixed Income Net Inflows: $5.4 billion, mainly from institutional clients.
- ETF Net Inflows: $3.26 billion, with notable inflows in specific ETFs.
- Adjusted Net Revenue: $1.8 billion, a marginal increase from Q1 2024, down 3.6% from Q4 2020.
- Investment Advisory Revenue: $1.6 billion, a 4% increase compared to Q1 2024.
- Annualized Effective Fee Rate: 40 basis points, excluding performance-based fees, a decline from prior periods.
- Adjusted Operating Expenses: $1.1 billion, a 7.4% increase from Q1 2020.
- Capital Returned to Stockholders: Over $500 million in Q1, including $289 million in dividends and $217.5 million in share buybacks.
- Cash and Discretionary Investments: $3.3 billion as of March 31, 2025.
For the complete transcript of the earnings call, please refer to the full earnings call transcript.
Positive Points
- T. Rowe Price Group Inc (TROW, Financial) reported improved investment performance, with over 60% of their funds outperforming their peer groups across various time periods.
- The company strengthened its leadership position in retirement, expanding its reach beyond the United States with new partnerships in Japan, Korea, and Canada.
- T. Rowe Price Group Inc (TROW) launched new ETFs and SMA offerings, increasing their ETF assets under management to over $12.5 billion.
- The firm maintained a strong balance sheet with $3.3 billion in cash and discretionary investments, allowing for continued capital returns to stockholders.
- T. Rowe Price Group Inc (TROW) was recognized for its workplace and investment capabilities, being named one of Fortune Magazine's World's Most Admired Companies for the 15th consecutive year.
Negative Points
- The company experienced $8.6 billion in net outflows during the first quarter, primarily driven by US equities and rebalancing activities.
- Adjusted earnings per share decreased to $2.23 from $2.38 in the same quarter last year.
- The effective fee rate declined due to a mix shift in assets, with a trend towards lower-cost vehicles such as ETFs and collective investment trusts.
- Deployment of capital in private lending funds was muted due to a slow M&A environment, impacting fee-based AUM growth.
- Market volatility led to increased retail outflows in early April, although this normalized later in the month.