

Keefe Bruyette analyst Kyle Voigt has increased the price target for MarketAxess (MKTX, Financial) shares to $226, up from the previous target of $223. Voigt maintains a Market Perform rating on the stock. In a research note, the analyst indicated that current market consensus may not be completely accounting for the possible challenges related to a blended fee per million, which are likely due to changes in protocol mix. This adjustment reflects Voigt's insights into the company's financial dynamics and anticipated market conditions.
Wall Street Analysts Forecast
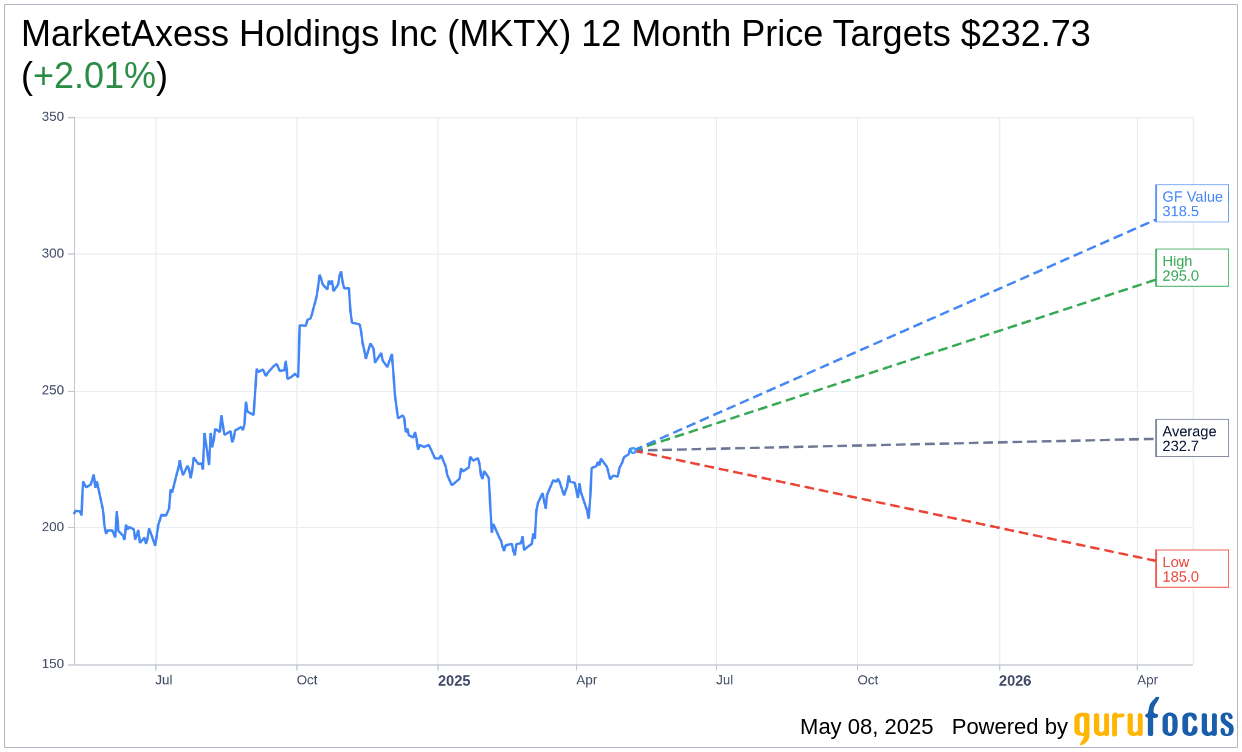
Based on the one-year price targets offered by 11 analysts, the average target price for MarketAxess Holdings Inc (MKTX, Financial) is $232.73 with a high estimate of $295.00 and a low estimate of $185.00. The average target implies an upside of 2.01% from the current price of $228.14. More detailed estimate data can be found on the MarketAxess Holdings Inc (MKTX) Forecast page.
Based on the consensus recommendation from 14 brokerage firms, MarketAxess Holdings Inc's (MKTX, Financial) average brokerage recommendation is currently 2.6, indicating "Hold" status. The rating scale ranges from 1 to 5, where 1 signifies Strong Buy, and 5 denotes Sell.
Based on GuruFocus estimates, the estimated GF Value for MarketAxess Holdings Inc (MKTX, Financial) in one year is $318.50, suggesting a upside of 39.61% from the current price of $228.14. GF Value is GuruFocus' estimate of the fair value that the stock should be traded at. It is calculated based on the historical multiples the stock has traded at previously, as well as past business growth and the future estimates of the business' performance. More detailed data can be found on the MarketAxess Holdings Inc (MKTX) Summary page.
MKTX Key Business Developments
Release Date: May 07, 2025
- Total Revenue: $209 million, compared to $210 million in the prior year.
- Commission Revenue: Decreased 2%, with total commission revenue at $181 million.
- Services Revenue Growth: Increased 7%, driven by a 9% increase in information services revenue to $13 million.
- Post-trade Services Revenue: $11 million, increased 3% versus the prior year.
- Technology Services Revenue: $3 million, increased 14%.
- Diluted Earnings Per Share: $0.40 or $1.87 per share, excluding notable items.
- Operating Expenses: $120 million, increased 2% compared to the prior year.
- Free Cash Flow: $344 million over the trailing 12 months, an increase of 5% over the last quarter.
- Share Repurchases: 251,000 shares year-to-date through April 2025 for a total of $52 million.
- Cash Equivalents and Investments: $642 million as of March 31, down from $699 million at the end of 2024.
- Effective Tax Rate Guidance: GAAP basis expected to be 41% to 42%; excluding notable items, expected to be 26% to 27%.
For the complete transcript of the earnings call, please refer to the full earnings call transcript.
Positive Points
- MarketAxess Holdings Inc (MKTX, Financial) reported record commission revenue in international and new product areas, including emerging markets, municipals, and US government bonds.
- The company achieved a single-day trading record of $102 billion in US government bonds on April 9, driven by increased velocity and institutional clients leveraging new algorithms.
- Services revenue grew by 7%, with strong growth in information services revenue and technology services revenue.
- MarketAxess Holdings Inc (MKTX) demonstrated cost discipline with expenses increasing only 2%, benefiting from lower variable costs.
- The company made significant progress in expanding its algo suite for rates and plans to launch an enhanced RFQ solution soon.
Negative Points
- US credit market share across key protocols remains a challenge, partially offsetting growth in other areas.
- Commission revenue decreased by 2%, largely due to lower fee per million and market share in US credit.
- The effective tax rate is expected to increase due to a new reserve for uncertain tax positions, impacting future financials.
- Total revenue was relatively flat compared to the prior year, with only a slight decrease from $210 million to $209 million.
- The balance sheet saw a decline in cash equivalents and investments, primarily due to cash incentive compensation payouts and share repurchase activity.