

Consolidated net sales for SBH are projected to decline by about 50 basis points when compared to comparable sales, primarily due to anticipated adverse effects from foreign currency fluctuations. In terms of profitability, the adjusted operating margin is forecasted to land between 8.0% and 8.5%.
Wall Street Analysts Forecast
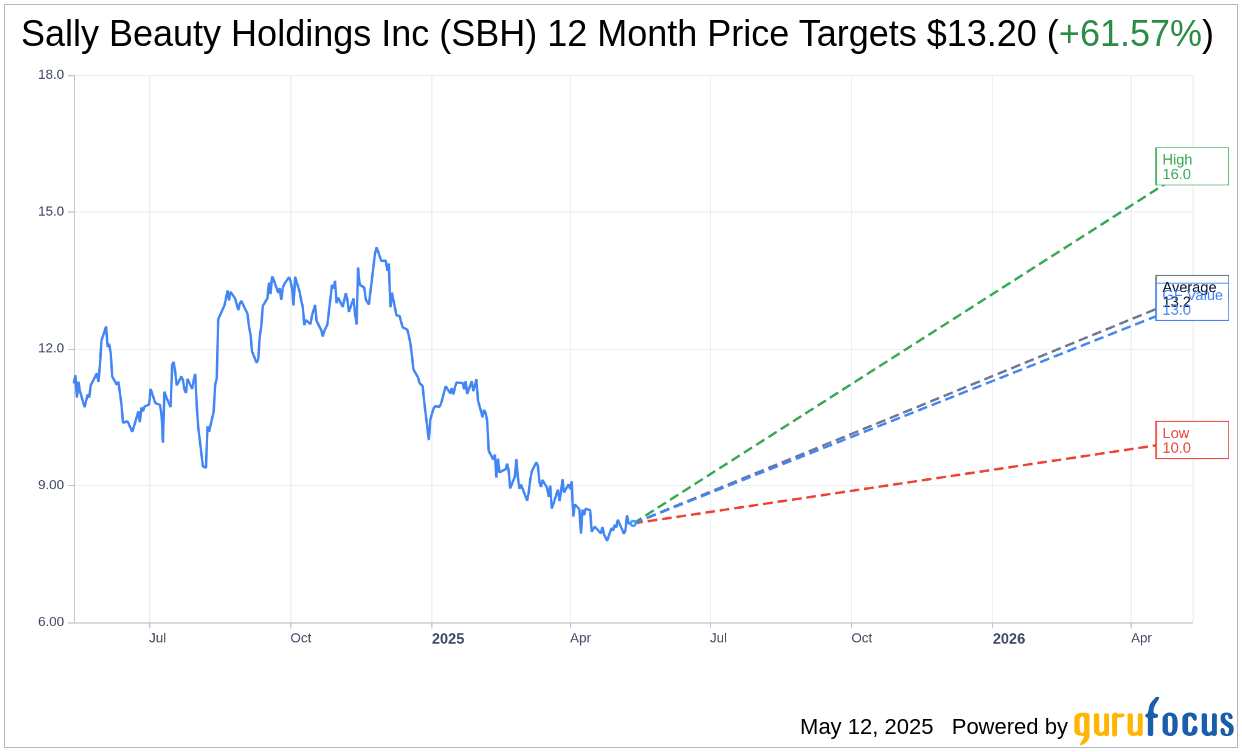
Based on the one-year price targets offered by 5 analysts, the average target price for Sally Beauty Holdings Inc (SBH, Financial) is $13.20 with a high estimate of $16.00 and a low estimate of $10.00. The average target implies an upside of 61.57% from the current price of $8.17. More detailed estimate data can be found on the Sally Beauty Holdings Inc (SBH) Forecast page.
Based on the consensus recommendation from 6 brokerage firms, Sally Beauty Holdings Inc's (SBH, Financial) average brokerage recommendation is currently 2.7, indicating "Hold" status. The rating scale ranges from 1 to 5, where 1 signifies Strong Buy, and 5 denotes Sell.
Based on GuruFocus estimates, the estimated GF Value for Sally Beauty Holdings Inc (SBH, Financial) in one year is $13.03, suggesting a upside of 59.49% from the current price of $8.17. GF Value is GuruFocus' estimate of the fair value that the stock should be traded at. It is calculated based on the historical multiples the stock has traded at previously, as well as past business growth and the future estimates of the business' performance. More detailed data can be found on the Sally Beauty Holdings Inc (SBH) Summary page.
SBH Key Business Developments
Release Date: February 13, 2025
- Consolidated Net Sales: $938 million, an increase of 0.7% despite a $6 million foreign currency headwind.
- Comparable Sales Growth: 1.6% across both Sally Beauty and BSG segments.
- Gross Margin: Expanded by 60 basis points to 50.8%.
- Adjusted Operating Margin: 8.4%, an increase of 50 basis points.
- Adjusted EBITDA Margin: 11.7%, up 20 basis points.
- Adjusted Diluted EPS: $0.43, up 10% year-over-year.
- Free Cash Flow: $57 million, including $44 million from the sale of corporate office.
- Net Debt Leverage Ratio: 1.9 times, within target range of 1.5 to 2 times.
- Share Repurchases: $10 million of stock repurchased.
- Sally Beauty Segment Sales: $525 million, with comparable sales up 1.7%.
- BSG Segment Sales: $412 million, with comparable sales up 1.4%.
- Global E-commerce Sales: $99 million, up 9% year-over-year, representing 11% of total net sales.
- Inventory Levels: Slightly over $1 billion, essentially flat to last year.
- Capital Expenditures: $20 million in the quarter.
For the complete transcript of the earnings call, please refer to the full earnings call transcript.
Positive Points
- Sally Beauty Holdings Inc (SBH, Financial) reported a third consecutive quarter of positive topline performance in both business segments.
- The company achieved a gross margin expansion of 60 basis points to 50.8%, driven by reduced shrink and lower distribution and freight costs.
- Sally Beauty Holdings Inc (SBH) saw strong e-commerce growth, with sales up 9% year-over-year, representing 11% of total net sales.
- The 'Fuel for Growth' program is on track to deliver significant savings, with $40 to $45 million expected in fiscal 2025.
- The company successfully launched new product innovations and expanded distribution, contributing to sales growth in both Sally and BSG segments.
Negative Points
- Sally Beauty Holdings Inc (SBH) faced a $6 million headwind from foreign currency translation, impacting sales.
- The company anticipates a flat comparable sales growth for Q2 due to macroeconomic pressures such as flu season and weather disruptions.
- There is a noted decline in traffic trends, particularly among non-color customers, affecting overall store visits.
- The promotional environment remains competitive, requiring strategic management to maintain margins.
- Potential tariff impacts and vendor exposure remain a concern, although the company has strategies in place to mitigate these risks.