
Raymond James has revised its price target for Fidus Investment (FDUS, Financial), bringing it down to $22 from a previous estimate of $23. Despite this adjustment, the financial firm maintains an Outperform rating on the stock. According to their analysis, Fidus Investment reported a strong earnings quarter, marked by an increase in its net asset value (NAV) per share, even as many competitors experienced declines in NAV. The firm views Fidus as having a favorable risk-to-reward ratio.
Wall Street Analysts Forecast
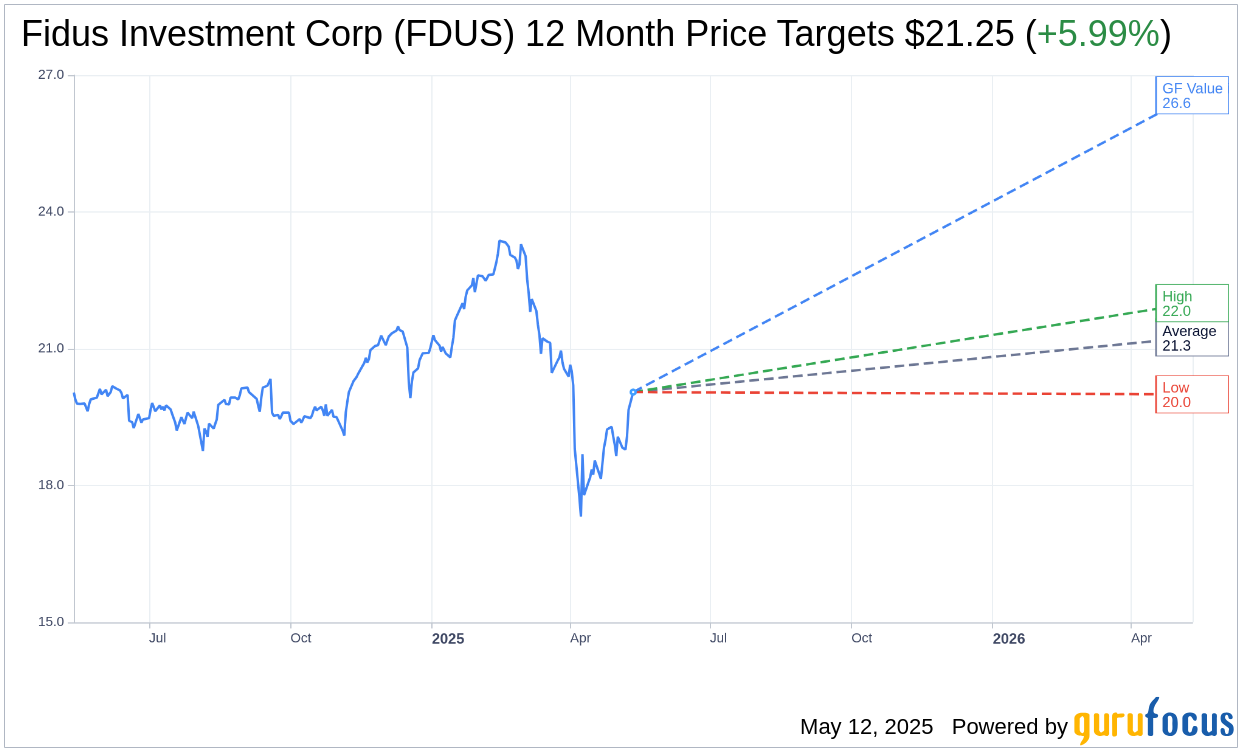
Based on the one-year price targets offered by 4 analysts, the average target price for Fidus Investment Corp (FDUS, Financial) is $21.25 with a high estimate of $22.00 and a low estimate of $20.00. The average target implies an upside of 5.99% from the current price of $20.05. More detailed estimate data can be found on the Fidus Investment Corp (FDUS) Forecast page.
Based on the consensus recommendation from 5 brokerage firms, Fidus Investment Corp's (FDUS, Financial) average brokerage recommendation is currently 2.0, indicating "Outperform" status. The rating scale ranges from 1 to 5, where 1 signifies Strong Buy, and 5 denotes Sell.
Based on GuruFocus estimates, the estimated GF Value for Fidus Investment Corp (FDUS, Financial) in one year is $26.56, suggesting a upside of 32.47% from the current price of $20.05. GF Value is GuruFocus' estimate of the fair value that the stock should be traded at. It is calculated based on the historical multiples the stock has traded at previously, as well as past business growth and the future estimates of the business' performance. More detailed data can be found on the Fidus Investment Corp (FDUS) Summary page.
FDUS Key Business Developments
Release Date: May 09, 2025
- Assets Under Management: Approximately $1.2 billion on a fair value basis, up 6% compared to December 31, 2024.
- Adjusted Net Investment Income (NII): $18.5 million for the quarter, $0.54 per share compared to $0.59 per share in Q1 2024.
- Net Asset Value (NAV): $677.9 million or $19.39 per share at quarter end.
- Dividends Paid: Total of $0.54 per share, consisting of a base dividend of $0.43 and a supplemental dividend of $0.11 per share.
- Originations: $115.6 million for the first quarter, with $102.1 million invested in seven new portfolio companies.
- Debt Investments: Totaled $111.6 million, with first lien securities accounting for approximately 94% of the total.
- Proceeds from Repayments and Realizations: $57.3 million for the first quarter.
- Total Investment Income: $36.5 million for the three months ended March 31.
- Total Expenses: $18.3 million for the first quarter.
- Net Investment Income (NII) Per Share: $0.53 per share for the three months ended March 31.
- Net Realized Gains: Approximately $11.5 million net of income tax from the sale of two portfolio companies.
- Debt Issuance: $100 million of five-year unsecured debt with a 6.75% coupon.
- Net Debt-to-Equity Ratio: 0.7 times as of March 31.
- Weighted Average Effective Yield on Debt Investments: 13.2% as of March 31.
- Liquidity and Capital Resources: Total liquidity of approximately $231.5 million as of March 31.
For the complete transcript of the earnings call, please refer to the full earnings call transcript.
Positive Points
- Fidus Investment Corp (FDUS, Financial) reported a 6% increase in assets under management, reaching approximately $1.2 billion on a fair value basis compared to December 31, 2024.
- Adjusted net investment income for the quarter was $18.5 million, showing an increase from $18.1 million in Q1 2024.
- The company declared a total dividend of $0.54 per share for the second quarter of 2025, maintaining the same level as the first quarter.
- Fidus Investment Corp (FDUS) successfully originated $115.6 million in the first quarter, with $102.1 million invested in seven new portfolio companies.
- The portfolio remains healthy with companies on nonaccrual accounting for less than 1% of the total portfolio on a fair value basis, indicating strong credit quality.
Negative Points
- Deal activity in the lower middle market remained modest, reflecting lackluster M&A trends.
- Total investment income decreased by $1 million from Q4 2024, primarily due to a decline in interest income and fee income.
- Net investment income per share decreased to $0.53 from $0.55 in Q4 2024.
- The weighted average yield on debt investments slightly decreased to 13.2% from 13.3% at the end of Q4 2024.
- The company faces uncertainty in the M&A market due to macroeconomic challenges and trade policy uncertainties, impacting future deal flow.