

The trading activity for CELH options is closely aligning with its usual volume, seeing 36,000 contracts exchanged. The preference for call options over puts is evident, with a put/call ratio standing at 0.36, which is lower than the standard level of around 0.46. Additionally, the implied volatility (IV30) for CELH has decreased by 2.64, reaching a value of 52.25. This places it in the bottom 10% of observations from the past year, indicating a projected daily price fluctuation of $1.21.
Moreover, the put-call skew has become steeper, highlighting a rising interest in securing protection against potential downward movements. Investors might be keen on exploring opportunities that offer strong fundamentals to guard against market volatility.
Wall Street Analysts Forecast
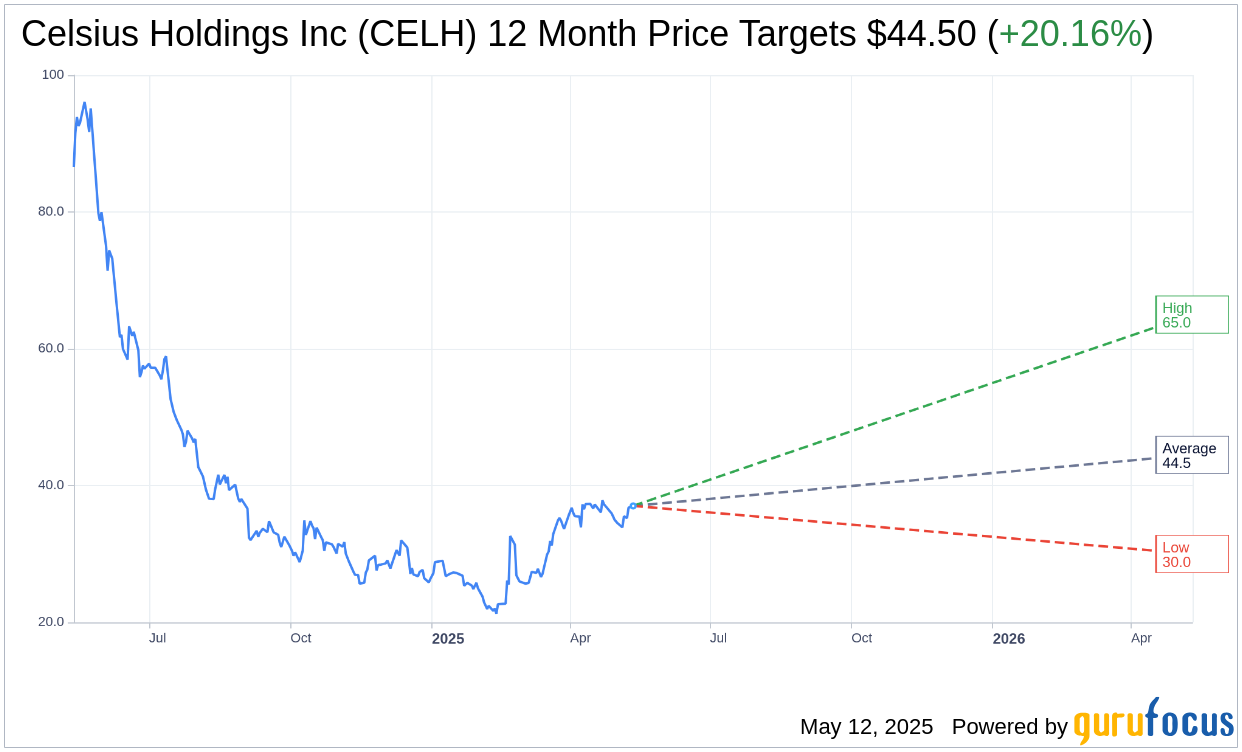
Based on the one-year price targets offered by 17 analysts, the average target price for Celsius Holdings Inc (CELH, Financial) is $44.50 with a high estimate of $65.00 and a low estimate of $30.00. The average target implies an upside of 20.16% from the current price of $37.03. More detailed estimate data can be found on the Celsius Holdings Inc (CELH) Forecast page.
Based on the consensus recommendation from 19 brokerage firms, Celsius Holdings Inc's (CELH, Financial) average brokerage recommendation is currently 2.3, indicating "Outperform" status. The rating scale ranges from 1 to 5, where 1 signifies Strong Buy, and 5 denotes Sell.
Based on GuruFocus estimates, the estimated GF Value for Celsius Holdings Inc (CELH, Financial) in one year is $119.80, suggesting a upside of 223.52% from the current price of $37.0299. GF Value is GuruFocus' estimate of the fair value that the stock should be traded at. It is calculated based on the historical multiples the stock has traded at previously, as well as past business growth and the future estimates of the business' performance. More detailed data can be found on the Celsius Holdings Inc (CELH) Summary page.
CELH Key Business Developments
Release Date: May 06, 2025
- Revenue: $329.3 million, a 7% decline compared to the prior year quarter.
- Gross Margin: Expanded 110 basis points to 52.3%.
- Adjusted EBITDA: $69.7 million with a margin of 21.2%.
- Net Income: $34.4 million or $0.15 per diluted share.
- Non-GAAP Adjusted Diluted EPS: $0.18 compared to $0.27 in the prior year period.
- International Revenue Growth: 41% increase to $22.8 million.
- Cash Position: $977 million in cash as of March 31, 2025, with no outstanding debt.
- Alani Nu Retail Sales: Increased 88% year-over-year, reaching a 5.3% share.
- Combined Portfolio Dollar Share: 16.2% for the quarter ending March 30, 2025.
- SG&A Expenses: $120.3 million, reflecting transaction-related expenses and investments.
For the complete transcript of the earnings call, please refer to the full earnings call transcript.
Positive Points
- Celsius Holdings Inc (CELH, Financial) successfully closed the acquisition of Alani Nu, adding a second billion-dollar brand to its portfolio.
- International revenue grew 41% to $22.8 million, demonstrating strong organic growth in both legacy and new markets.
- Gross margin expanded by 110 basis points to 52.3%, supported by sourcing efficiencies for raw and packaging materials.
- Celsius Holdings Inc (CELH) captured a 16.2% dollar share in the energy drink category, an 81-basis point increase year-over-year.
- The company launched new products, including CELSIUS HYDRATION, expanding into the fast-growing $1.4 billion hydration powder category.
Negative Points
- First quarter revenue declined by 7% compared to the prior year, totaling $329.3 million.
- The company faced slowed velocity in the first quarter, impacting overall sales performance.
- Increased competition and strong pricing actions by other category players posed challenges.
- Selling, general, and administrative expenses increased to $120.3 million, reflecting transaction-related expenses and continued investment.
- Non-GAAP adjusted EBITDA margin decreased to 21.2% from 24.7% in the prior year, driven by organizational investments.