
Long-established in the Hardware industry, Dell Technologies Inc (DELL, Financial) has enjoyed a stellar reputation. It has recently witnessed a daily gain of 0.15%, juxtaposed with a three-month change of -4.85%. However, fresh insights from the GF Score hint at potential headwinds. Notably, its diminished rankings in financial strength, growth, and valuation suggest that the company might not live up to its historical performance. Join us as we dive deep into these pivotal metrics to unravel the evolving narrative of Dell Technologies Inc.
Understanding the GF Score
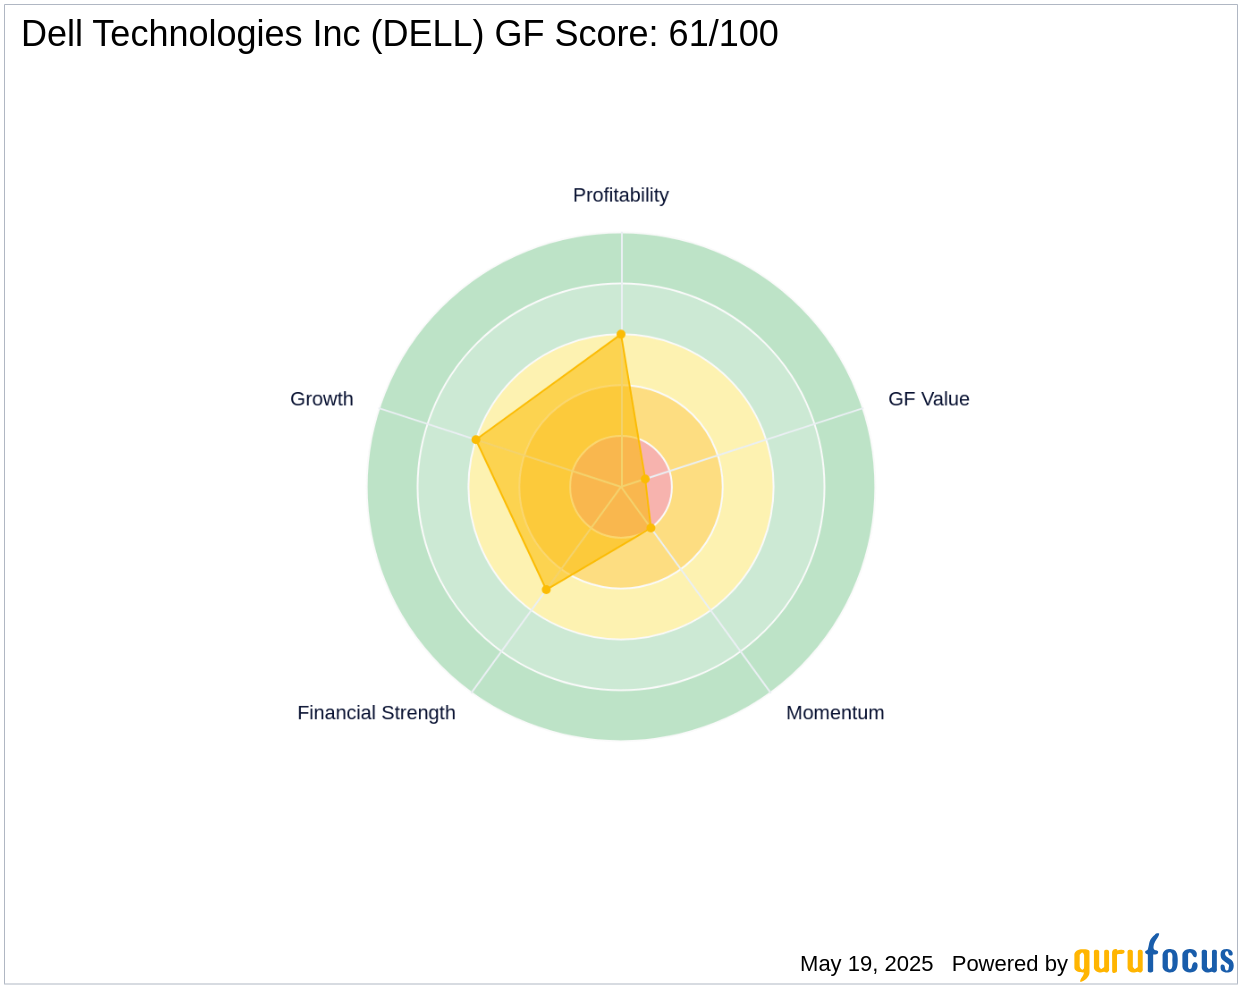
The GF Score is a stock performance ranking system developed by GuruFocus using five aspects of valuation, which has been found to be closely correlated to the long-term performances of stocks by backtesting from 2006 to 2021. The stocks with a higher GF Score generally generate higher returns than those with a lower GF Score. Therefore, when picking stocks, investors should invest in companies with high GF Scores. The GF Score ranges from 0 to 100, with 100 as the highest rank.
- Financial strength rank: 5/10
- Profitability rank: 6/10
- Growth rank: 6/10
- GF Value rank: 1/10
- Momentum rank: 2/10
Based on the above method, GuruFocus assigned Dell Technologies Inc the GF Score of 61 out of 100, which signals poor future outperformance potential.
Company Overview
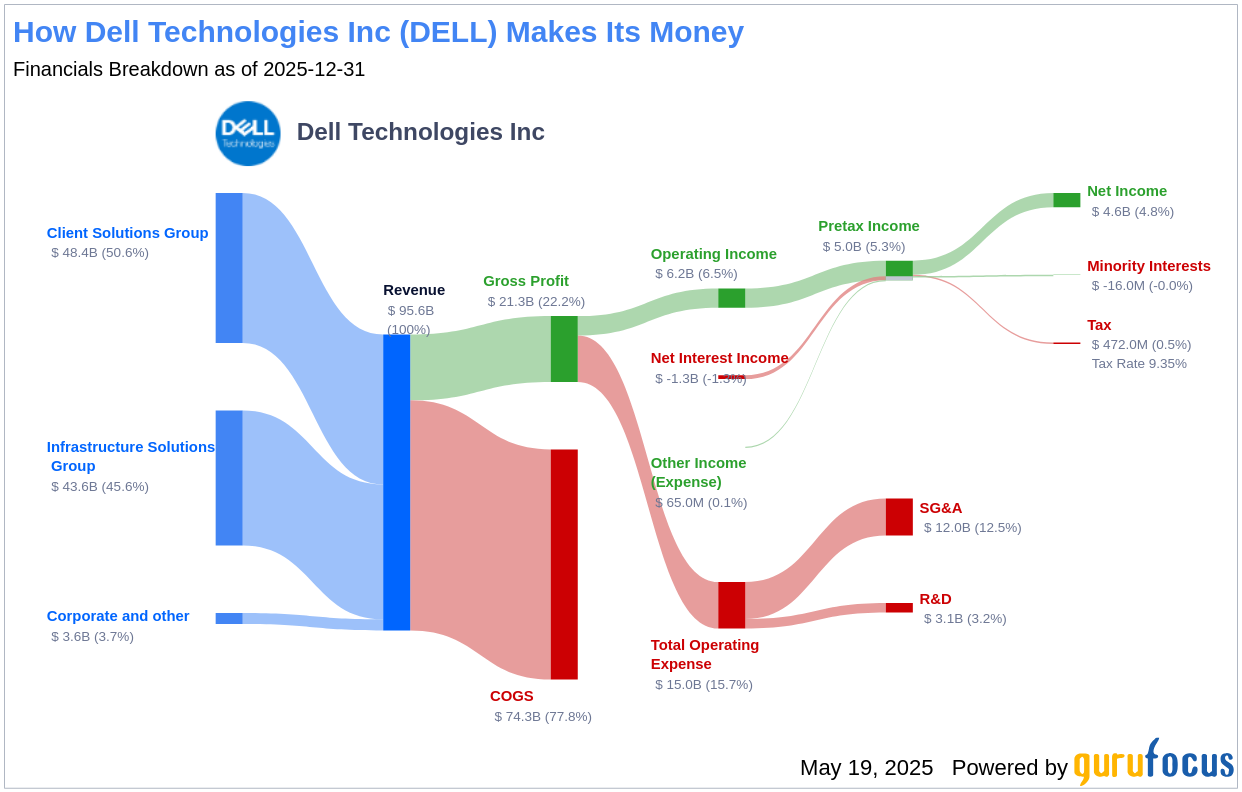
Dell Technologies Inc is a broad information technology vendor, primarily supplying hardware to enterprises. It is focused on premium and commercial personal computers and enterprise on-premises data center hardware. It holds top-three market shares in its core markets of personal computers, peripheral displays, mainstream servers, and external storage. Dell has a robust ecosystem of component and assembly partners, and also relies heavily on channel partners to fulfill its sales. With a market cap of $79.8 billion and sales amounting to $95.6 billion, the company maintains an operating margin of 6.53%.
Financial Strength Breakdown
Dell Technologies Inc's financial strength indicators present some concerning insights about the company's balance sheet health. Dell Technologies Inc has an interest coverage ratio of 4.4, which positions it worse than 73.27% of 1,605 companies in the Hardware industry. This ratio highlights potential challenges the company might face when handling its interest expenses on outstanding debt. It's worth noting that the esteemed investor Benjamin Graham typically favored companies with an interest coverage ratio of at least five.
The company's Altman Z-Score is just 1.88, which is below the safe threshold of 2.99. Although this does not imply immediate danger of financial distress, the stock may face some financial struggles if the Altman Z-score drops below 1.81. Additionally, the company's low cash-to-debt ratio at 0.15 indicates a struggle in handling existing debt levels.
Conclusion
In conclusion, Dell Technologies Inc's financial strength, profitability, and growth metrics, as highlighted by the GF Score, suggest potential underperformance. While the company has a strong market presence and a robust ecosystem, its financial indicators raise concerns about its ability to manage debt and sustain growth. Investors should carefully consider these factors when evaluating the company's future prospects. For those interested in exploring companies with stronger GF Scores, GuruFocus Premium members can use the following screener link: GF Score Screen.
This article, generated by GuruFocus, is designed to provide general insights and is not tailored financial advice. Our commentary is rooted in historical data and analyst projections, utilizing an impartial methodology, and is not intended to serve as specific investment guidance. It does not formulate a recommendation to purchase or divest any stock and does not consider individual investment objectives or financial circumstances. Our objective is to deliver long-term, fundamental data-driven analysis. Be aware that our analysis might not incorporate the most recent, price-sensitive company announcements or qualitative information. GuruFocus holds no position in the stocks mentioned herein.