
HCA Healthcare Inc (HCA, Financial) has recently been in the spotlight, drawing interest from investors and financial analysts due to its robust financial stance. With shares currently priced at $387.03, HCA Healthcare Inc has witnessed a daily loss of 0.13%, marked against a three-month change of 21.01%. A thorough analysis, underlined by the GF Score, suggests that HCA Healthcare Inc is well-positioned for substantial growth in the near future.
Understanding the GF Score
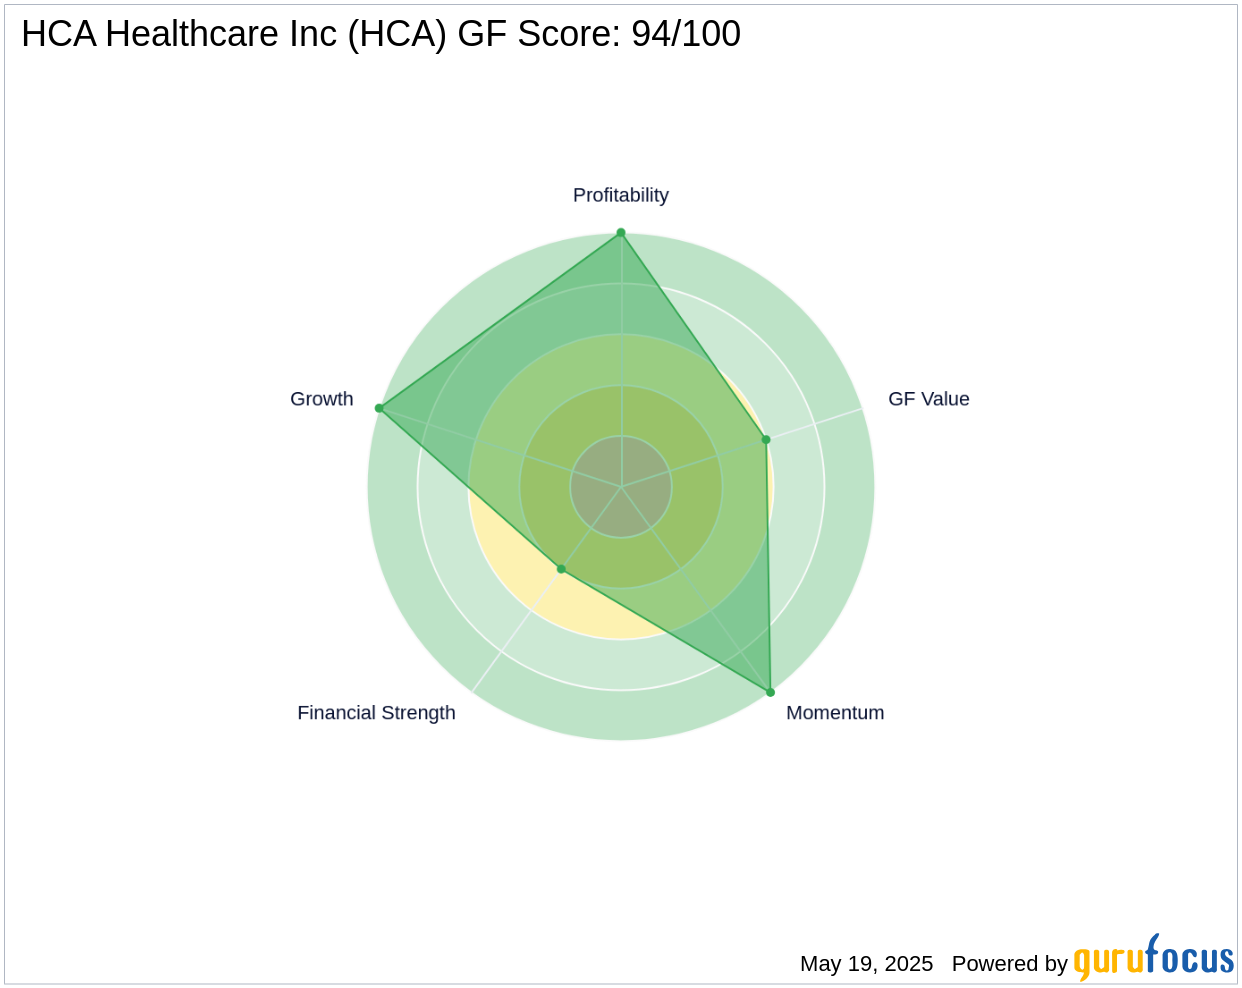
The GF Score is a stock performance ranking system developed by GuruFocus using five aspects of valuation, which has been found to be closely correlated to the long-term performances of stocks by backtesting from 2006 to 2021. The stocks with a higher GF Score generally generate higher returns than those with a lower GF Score. Therefore, when picking stocks, investors should invest in companies with high GF Scores. The GF Score ranges from 0 to 100, with 100 as the highest rank.
- Financial strength rank: 4/10
- Profitability rank: 10/10
- Growth rank: 10/10
- GF Value rank: 6/10
- Momentum rank: 10/10
Each one of these components is ranked and the ranks also have positive correlation with the long term performances of stocks. The GF score is calculated using the five key aspects of analysis. Through backtesting, we know that each of these key aspects has a different impact on the stock price performance. Thus, they are weighted differently when calculating the total score. With a GF Score of 94 out of 100, HCA Healthcare Inc signals the highest outperformance potential.
Understanding HCA Healthcare Inc Business
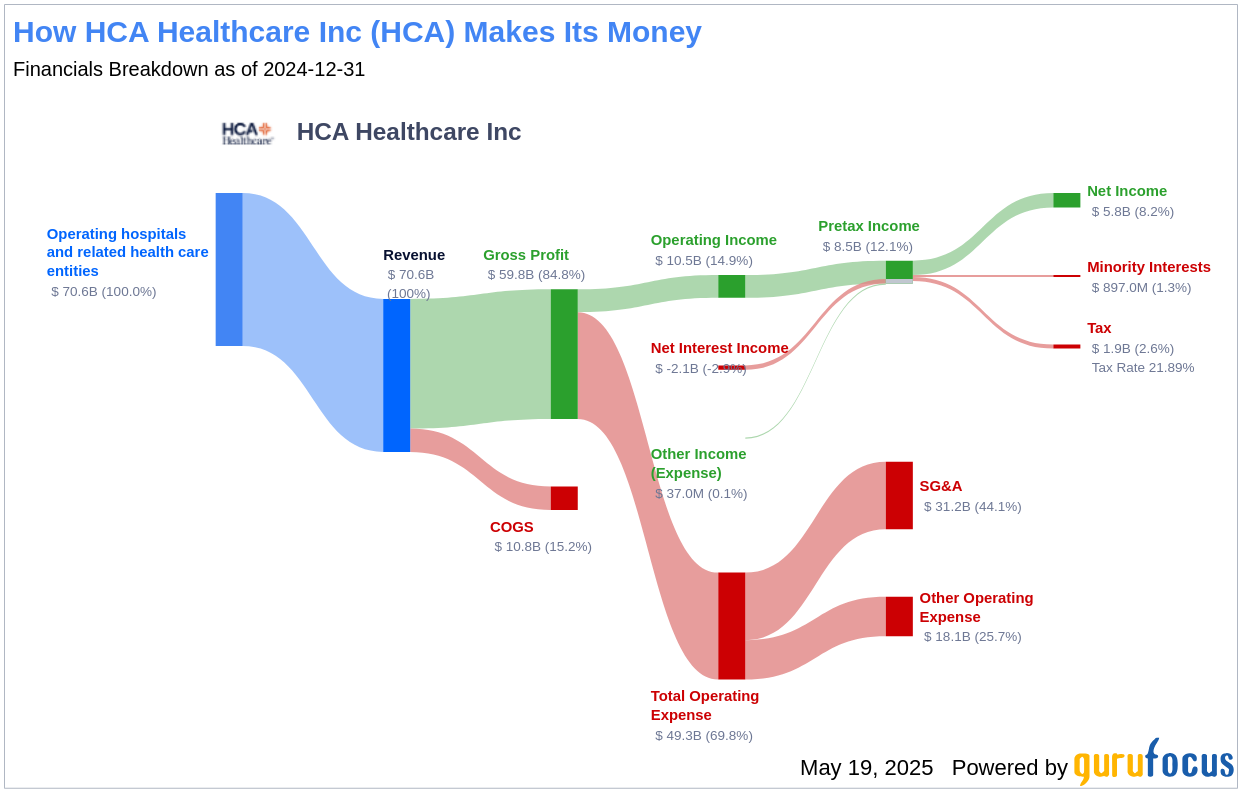
HCA Healthcare Inc is a Nashville-based healthcare provider organization operating the largest collection of acute-care hospitals in the United States. As of December 2024, the firm owned and operated 190 hospitals, 124 freestanding outpatient surgery centers, and a broad network of physician offices, urgent-care clinics, and freestanding emergency rooms across 20 states and a small foothold in England. With a market cap of $93.11 billion and sales amounting to $71.59 billion, HCA Healthcare Inc boasts an operating margin of 15.15%, reflecting its efficient management and operational prowess.
Profitability Rank Breakdown
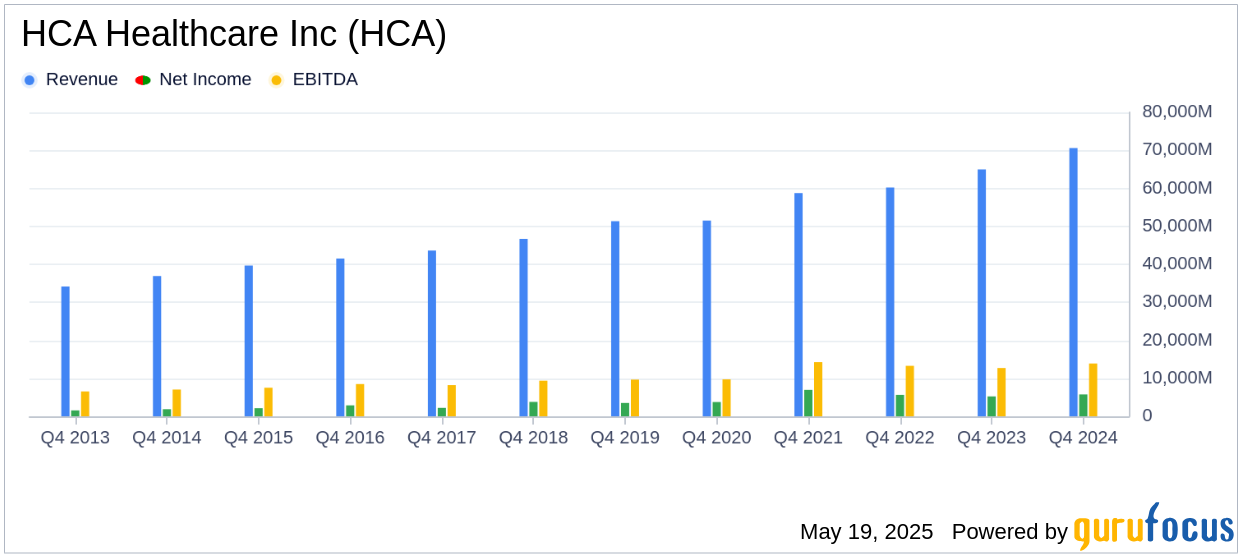
The Profitability Rank shows HCA Healthcare Inc's impressive standing among its peers in generating profit. HCA Healthcare Inc's Operating Margin has increased by 6.01% over the past five years, as shown by the following data: 2020: 14.09; 2021: 16.47; 2022: 15.03; 2023: 14.82; 2024: 14.94. Furthermore, the company's Gross Margin has seen a consistent rise over the past five years, as evidenced by the data: 2020: 83.76; 2021: 83.86; 2022: 84.44; 2023: 84.76; 2024: 84.77. This trend underscores the company's growing proficiency in transforming revenue into profit. HCA Healthcare Inc's strong Predictability Rank of 5.0 stars out of five underscores its consistent operational performance, providing investors with increased confidence.
Growth Rank Breakdown
Ranked highly in Growth, HCA Healthcare Inc demonstrates a strong commitment to expanding its business. The company's 3-Year Revenue Growth Rate is 14.7%, which outperforms better than 69.39% of 611 companies in the Healthcare Providers & Services industry. Moreover, HCA Healthcare Inc has seen a robust increase in its earnings before interest, taxes, depreciation, and amortization (EBITDA) over the past few years. Specifically, the three-year growth rate stands at 7, and the rate over the past five years is 14.5. This trend accentuates the company's continued capability to drive growth.
Conclusion: A Promising Future for HCA Healthcare Inc
HCA Healthcare Inc's financial strength, profitability, and growth metrics, as highlighted by the GF Score, underscore the firm's unparalleled position for potential outperformance. The company's strategic initiatives, robust operational framework, and consistent growth trajectory make it a compelling choice for value investors. As the healthcare industry continues to evolve, HCA Healthcare Inc is well-equipped to leverage its competitive advantages and drive sustained growth. For investors seeking companies with strong GF Scores, GuruFocus Premium members can explore more opportunities using the following screener link: GF Score Screen.
This article, generated by GuruFocus, is designed to provide general insights and is not tailored financial advice. Our commentary is rooted in historical data and analyst projections, utilizing an impartial methodology, and is not intended to serve as specific investment guidance. It does not formulate a recommendation to purchase or divest any stock and does not consider individual investment objectives or financial circumstances. Our objective is to deliver long-term, fundamental data-driven analysis. Be aware that our analysis might not incorporate the most recent, price-sensitive company announcements or qualitative information. GuruFocus holds no position in the stocks mentioned herein.