
Waste Management Inc (WM, Financial) has recently been in the spotlight, drawing interest from investors and financial analysts due to its robust financial stance. With shares currently priced at $234.04, Waste Management Inc has witnessed a daily gain of 0.06%, marked against a three-month change of 3.01%. A thorough analysis, underlined by the GF Score, suggests that Waste Management Inc is well-positioned for substantial growth in the near future.
Understanding the GF Score
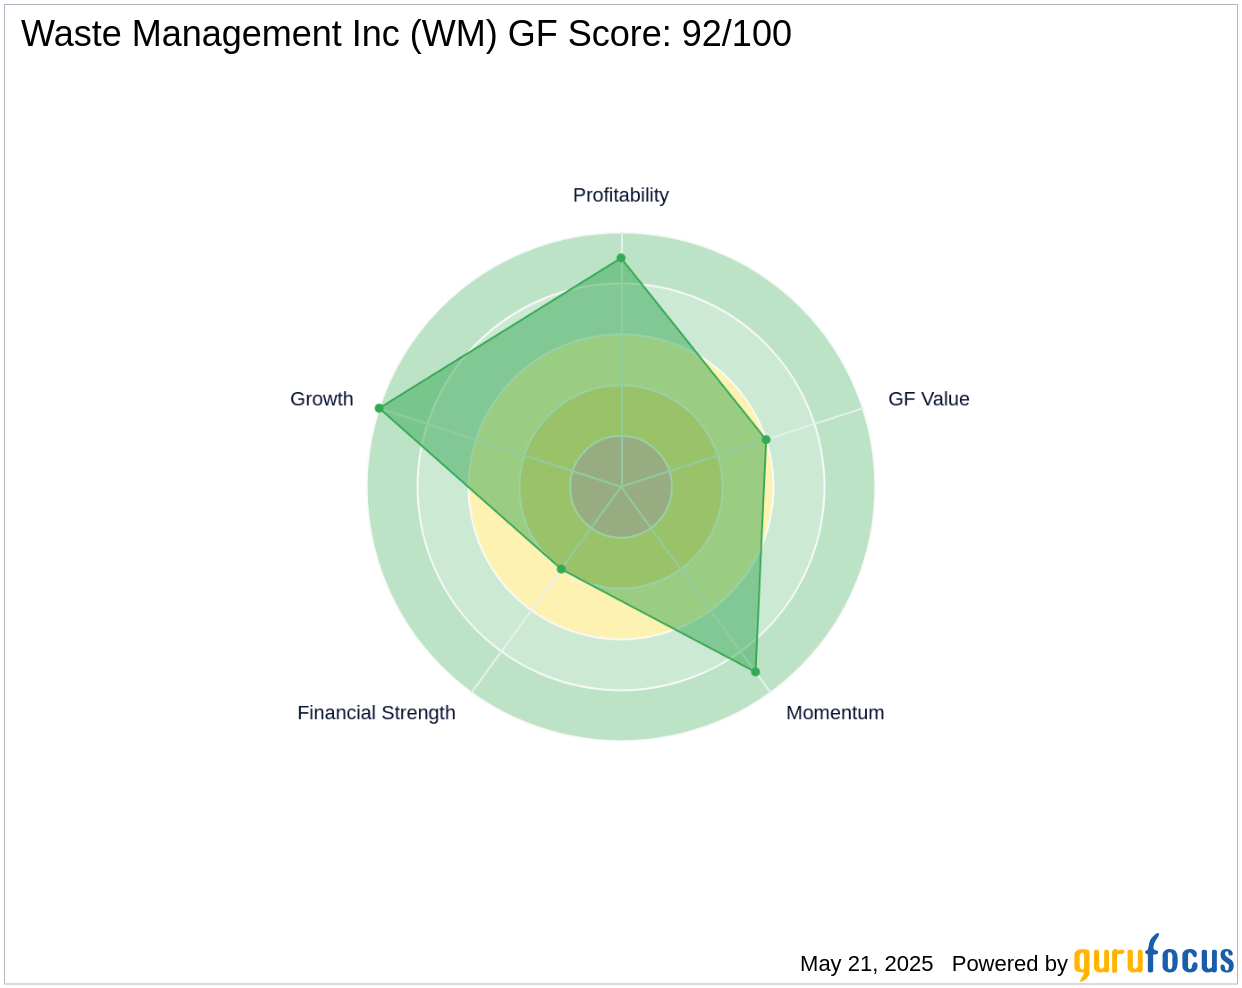
The GF Score is a stock performance ranking system developed by GuruFocus using five aspects of valuation, which has been found to be closely correlated to the long-term performances of stocks by backtesting from 2006 to 2021. The stocks with a higher GF Score generally generate higher returns than those with a lower GF Score. Therefore, when picking stocks, investors should invest in companies with high GF Scores. The GF Score ranges from 0 to 100, with 100 as the highest rank.
- Financial strength rank: 4/10
- Profitability rank: 9/10
- Growth rank: 10/10
- GF Value rank: 6/10
- Momentum rank: 9/10
Each one of these components is ranked and the ranks also have positive correlation with the long-term performances of stocks. The GF score is calculated using the five key aspects of analysis. Through backtesting, we know that each of these key aspects has a different impact on the stock price performance. Thus, they are weighted differently when calculating the total score. With a high GF Score of 92 out of 100, Waste Management Inc signals the highest outperformance potential.
Understanding Waste Management Inc's Business
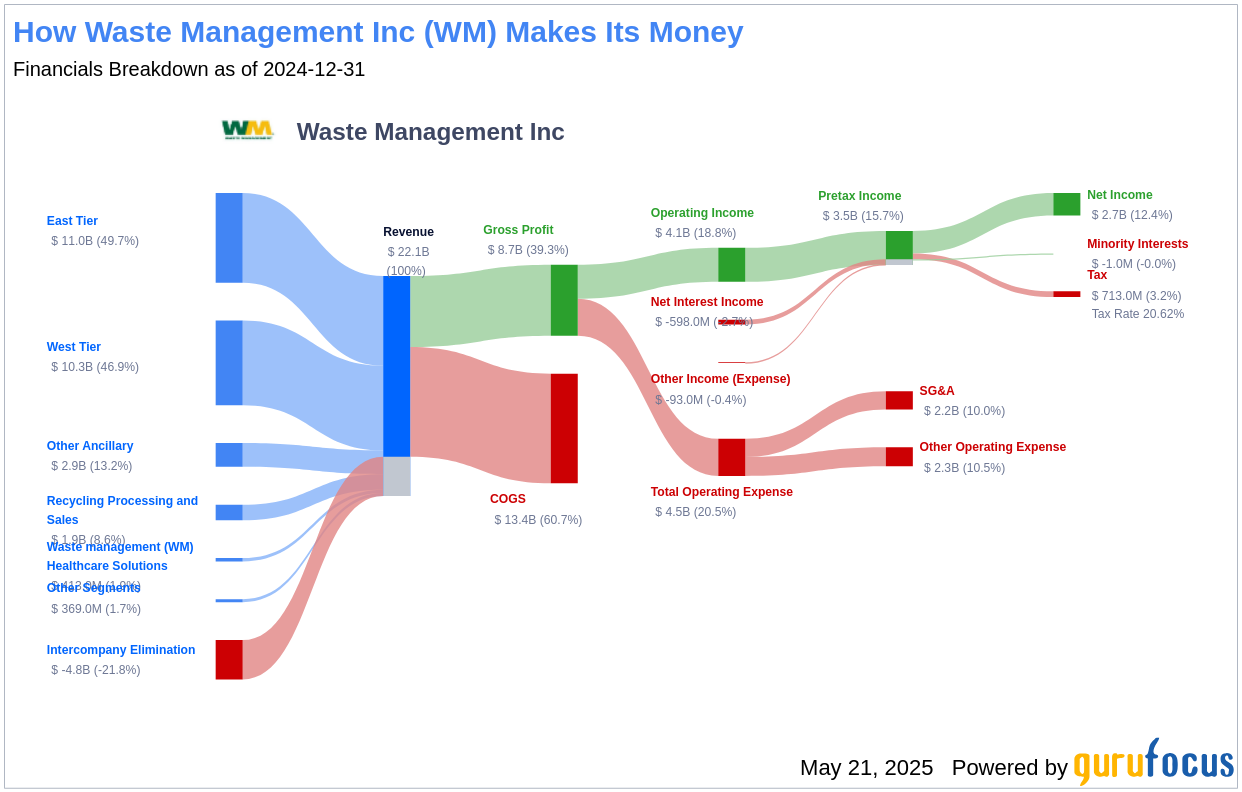
Waste Management Inc ranks as the largest integrated provider of traditional solid waste services in the United States, operating 263 active landfills and about 332 transfer stations. The company serves residential, commercial, industrial, and medical end markets and is also a leading recycler in North America. With a market cap of $94.18 billion and sales amounting to $22.92 billion, Waste Management Inc boasts an operating margin of 18.16%, reflecting its efficiency in managing operations and costs.
Profitability Rank Breakdown
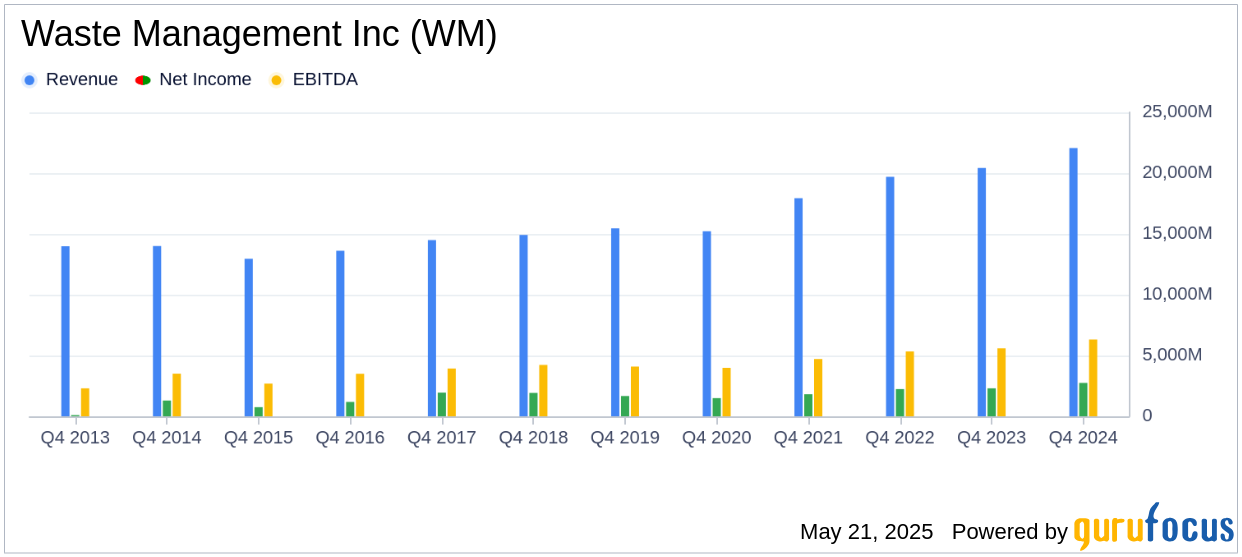
The Profitability Rank shows Waste Management Inc's impressive standing among its peers in generating profit. Waste Management Inc's Operating Margin has increased by 15.49% over the past five years, as shown by the following data: 2020: 16.28; 2021: 16.49; 2022: 17.40; 2023: 18.72; 2024: 18.81. Furthermore, the company's Gross Margin has seen a consistent rise over the past five years, underscoring its growing proficiency in transforming revenue into profit.
Waste Management Inc's strong Predictability Rank of 4.0 stars out of five underscores its consistent operational performance, providing investors with increased confidence.
Growth Rank Breakdown
Ranked highly in Growth, Waste Management Inc demonstrates a strong commitment to expanding its business. The company's 3-Year Revenue Growth Rate is 8.9%, which outperforms better than 62.1% of 219 companies in the Waste Management industry. Moreover, Waste Management Inc has seen a robust increase in its earnings before interest, taxes, depreciation, and amortization (EBITDA) over the past few years. Specifically, the three-year growth rate stands at 12, and the rate over the past five years is 11.3. This trend accentuates the company's continued capability to drive growth.
Conclusion: A Promising Future for Waste Management Inc
With its strong financial strength, impressive profitability, and robust growth metrics, Waste Management Inc's high GF Score highlights the firm's unparalleled position for potential outperformance. As the largest integrated provider of traditional solid waste services in the U.S., Waste Management Inc is well-equipped to leverage its market position and continue its growth trajectory. For investors seeking companies with strong GF Scores, GuruFocus Premium members can find more opportunities using the following screener link: GF Score Screen.
This article, generated by GuruFocus, is designed to provide general insights and is not tailored financial advice. Our commentary is rooted in historical data and analyst projections, utilizing an impartial methodology, and is not intended to serve as specific investment guidance. It does not formulate a recommendation to purchase or divest any stock and does not consider individual investment objectives or financial circumstances. Our objective is to deliver long-term, fundamental data-driven analysis. Be aware that our analysis might not incorporate the most recent, price-sensitive company announcements or qualitative information. GuruFocus holds no position in the stocks mentioned herein.