

Lemonade (LMND, Financial) is witnessing a significant increase in bullish option trading, with 6,595 call options exchanged. This activity exceeds typical expectations by 1.6 times, and the implied volatility has risen by nearly 3 percentage points to 67.49%.
The most frequently traded options include the 5/23 weekly 30.5 calls and the 5/30 weekly 35 calls, together accounting for nearly 1,600 contracts. The current Put/Call Ratio stands at 0.30, indicating a tilt towards call options.
Investors are looking ahead to Lemonade's upcoming earnings report, anticipated on August 5th, which could further influence trading activity around the stock.
Wall Street Analysts Forecast
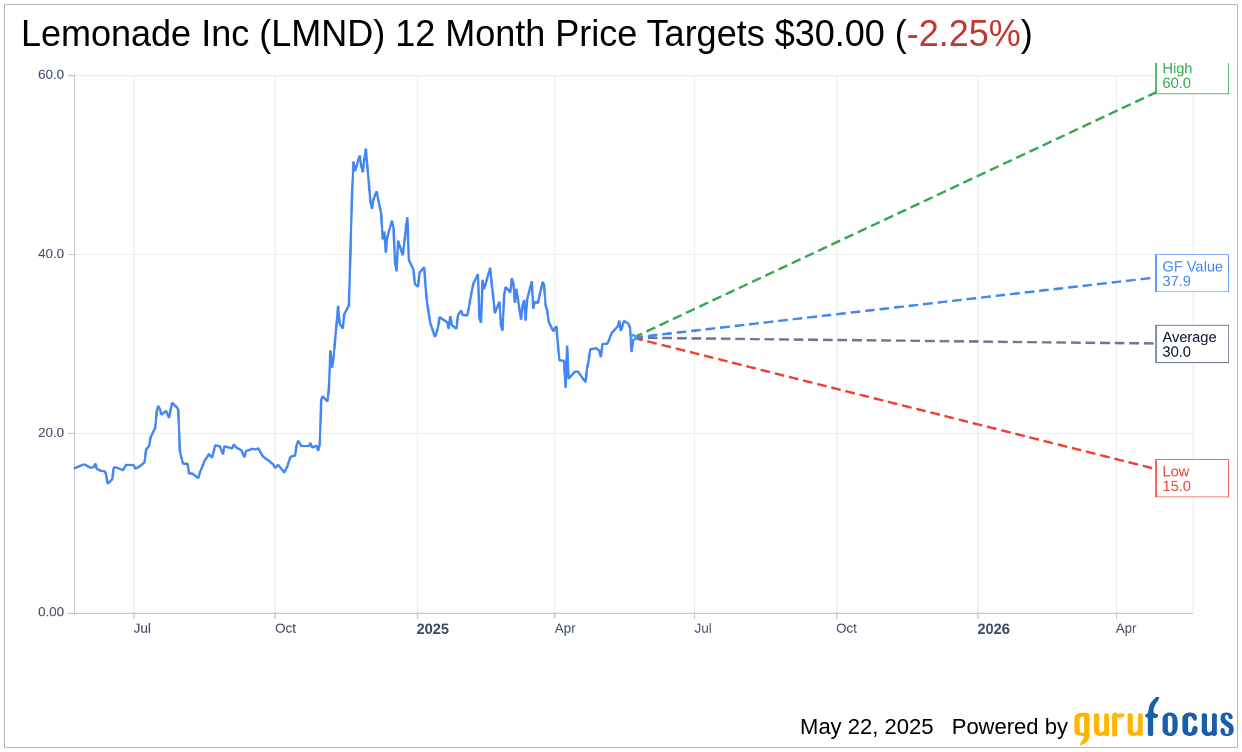
Based on the one-year price targets offered by 7 analysts, the average target price for Lemonade Inc (LMND, Financial) is $30.00 with a high estimate of $60.00 and a low estimate of $15.00. The average target implies an downside of 4.31% from the current price of $31.35. More detailed estimate data can be found on the Lemonade Inc (LMND) Forecast page.
Based on the consensus recommendation from 10 brokerage firms, Lemonade Inc's (LMND, Financial) average brokerage recommendation is currently 3.4, indicating "Hold" status. The rating scale ranges from 1 to 5, where 1 signifies Strong Buy, and 5 denotes Sell.
Based on GuruFocus estimates, the estimated GF Value for Lemonade Inc (LMND, Financial) in one year is $37.89, suggesting a upside of 20.86% from the current price of $31.35. GF Value is GuruFocus' estimate of the fair value that the stock should be traded at. It is calculated based on the historical multiples the stock has traded at previously, as well as past business growth and the future estimates of the business' performance. More detailed data can be found on the Lemonade Inc (LMND) Summary page.
LMND Key Business Developments
Release Date: May 06, 2025
- Revenue: Increased 27% year-on-year to $151 million in Q1 2025.
- In Force Premium (IFP): Grew 27% to just above $1 billion.
- Customer Count: Increased by 21% to 2.5 million.
- Premium per Customer: Increased 4% to $396.
- Annual Retention Rate (ADR): Decreased to 84% from 86% in the prior quarter.
- Gross Earned Premium: Increased 24% to $234 million.
- Gross Loss Ratio: 78% for Q1, compared to 79% in Q1 2024.
- Adjusted Gross Profit: Improved 25% year-on-year.
- Net Loss: $62 million, or a loss of $0.86 per share.
- Adjusted EBITDA Loss: $47 million in Q1.
- Total Cash, Cash Equivalents, and Investments: Approximately $996 million.
- Growth Spend: $38 million in Q1, nearly double the prior year quarter.
- Technology Development Expense: Increased 5% to $22 million.
- General and Administrative (G&A) Expense: Increased 20% to $36 million.
For the complete transcript of the earnings call, please refer to the full earnings call transcript.
Positive Points
- Lemonade Inc (LMND, Financial) reported a 27% year-on-year growth in Q1 2025, marking the sixth consecutive quarter of accelerating top-line growth.
- The company achieved a 25% year-on-year improvement in adjusted gross profit, despite the impact of California wildfires.
- Lemonade Car's quarter-over-quarter in-force premium (IFP) growth outpaced the rest of the business for the first time, signaling strong momentum.
- The company is on track to achieve EBITDA breakeven by the end of 2026, with expectations of generating positive adjusted free cash flow in 2025.
- Lemonade Inc (LMND) has successfully leveraged AI to maintain or reduce fixed costs while significantly increasing its book size, demonstrating strong operational efficiency.
Negative Points
- The California wildfires had a notable impact on Q1 results, contributing 16 percentage points to the gross loss ratio.
- Annual dollar retention (ADR) decreased to 84%, down from 86% in the prior quarter, partly due to efforts to improve profitability in the home insurance book.
- The gross loss ratio for Q1 was 78%, slightly higher than the previous year's 79%, indicating ongoing challenges in managing claims costs.
- Operating expenses, excluding loss and loss adjustment expense, increased by 29% year-on-year, driven by growth spend and the impact of the FAIR plan assessment.
- Net loss for Q1 was $62 million, or $0.86 per share, compared to a net loss of $47 million or $0.67 per share in the prior year, reflecting ongoing financial challenges.