

On May 23, 2025, Radian Group (RDN, Financial) received significant attention in the stock market following an update from analyst Giuliano Bologna of Compass Point. The financial services company, known for its role in the mortgage insurance sector, experienced a change in its stock rating and price target.
Compass Point has downgraded Radian Group (RDN, Financial) from a previous "Buy" rating to a "Neutral" rating. This decision reflects a shift in sentiment from the analyst, who had previously suggested a more optimistic outlook on the stock.
Despite the downgrade in rating, the analyst has simultaneously raised the price target for Radian Group (RDN, Financial) from $34.00 to $37.00 USD. This adjustment represents an 8.82% increase in the target price, indicating a revised valuation outlook for the company's stock.
Investors will be closely monitoring Radian Group (RDN, Financial) in the coming days as they assess the implications of Compass Point's updated guidance on their investment strategies.
Wall Street Analysts Forecast
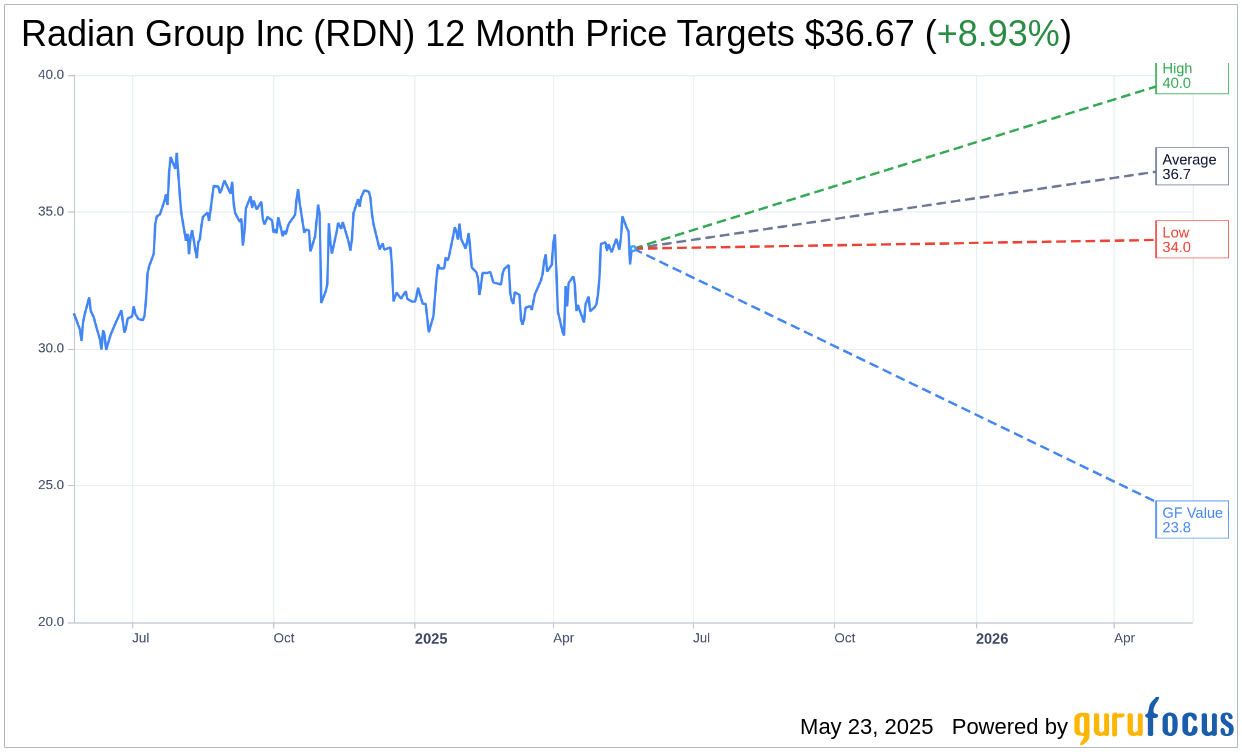
Based on the one-year price targets offered by 6 analysts, the average target price for Radian Group Inc (RDN, Financial) is $36.67 with a high estimate of $40.00 and a low estimate of $34.00. The average target implies an upside of 8.93% from the current price of $33.66. More detailed estimate data can be found on the Radian Group Inc (RDN) Forecast page.
Based on the consensus recommendation from 6 brokerage firms, Radian Group Inc's (RDN, Financial) average brokerage recommendation is currently 2.8, indicating "Hold" status. The rating scale ranges from 1 to 5, where 1 signifies Strong Buy, and 5 denotes Sell.
Based on GuruFocus estimates, the estimated GF Value for Radian Group Inc (RDN, Financial) in one year is $23.76, suggesting a downside of 29.41% from the current price of $33.66. GF Value is GuruFocus' estimate of the fair value that the stock should be traded at. It is calculated based on the historical multiples the stock has traded at previously, as well as past business growth and the future estimates of the business' performance. More detailed data can be found on the Radian Group Inc (RDN) Summary page.