
REX American Resources Corp (REX, Financial) is set to release its Q1 2025 earnings on May 28, 2025. The consensus estimate for Q1 2025 revenue is $161.27 million, and the earnings are expected to come in at $0.34 per share. The full year 2025's revenue is expected to be $656.93 million, and the earnings are expected to be $1.55 per share. More detailed estimate data can be found on the Forecast page.
REX American Resources Corp (REX, Financial) Estimates Trends
Revenue estimates for REX American Resources Corp (REX) have declined from $691.77 million to $656.93 million for the full year 2025 and from $772.20 million to $769.34 million for 2026 over the past 90 days. Earnings estimates have increased from $1.35 per share to $1.55 per share for the full year 2025, while they have declined from $3.01 per share to $3.00 per share for 2026 over the past 90 days.
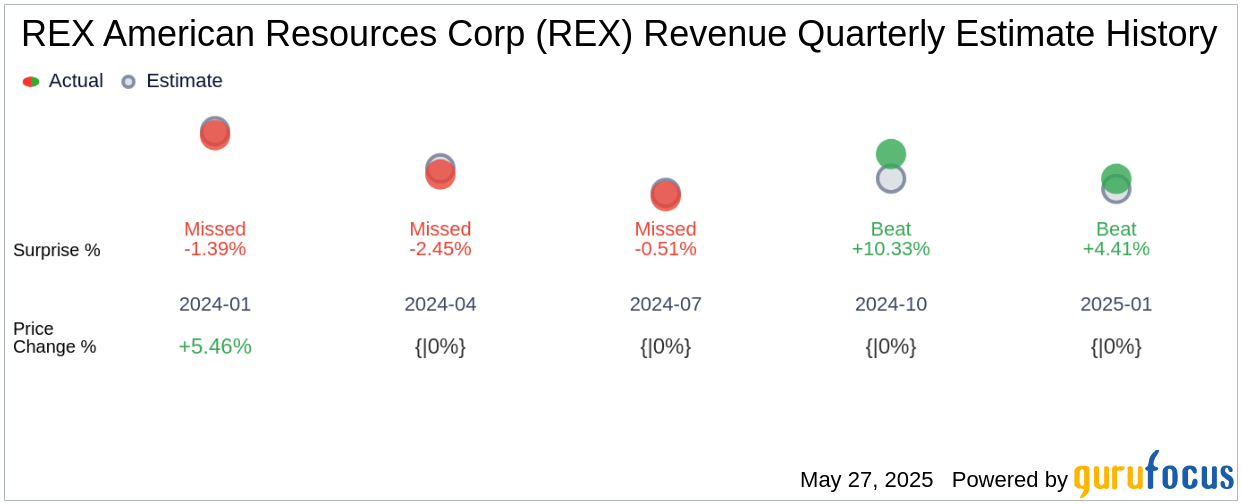
REX American Resources Corp (REX, Financial) Reported History
In the previous quarter ending January 31, 2025, REX American Resources Corp's (REX) actual revenue was $158.23 million, which beat analysts' revenue expectations of $151.54 million by 4.41%. REX American Resources Corp's (REX) actual earnings were $0.63 per share, which beat analysts' earnings expectations of $0.28 per share by 125%. After releasing the results, REX American Resources Corp (REX) was flat in one day.
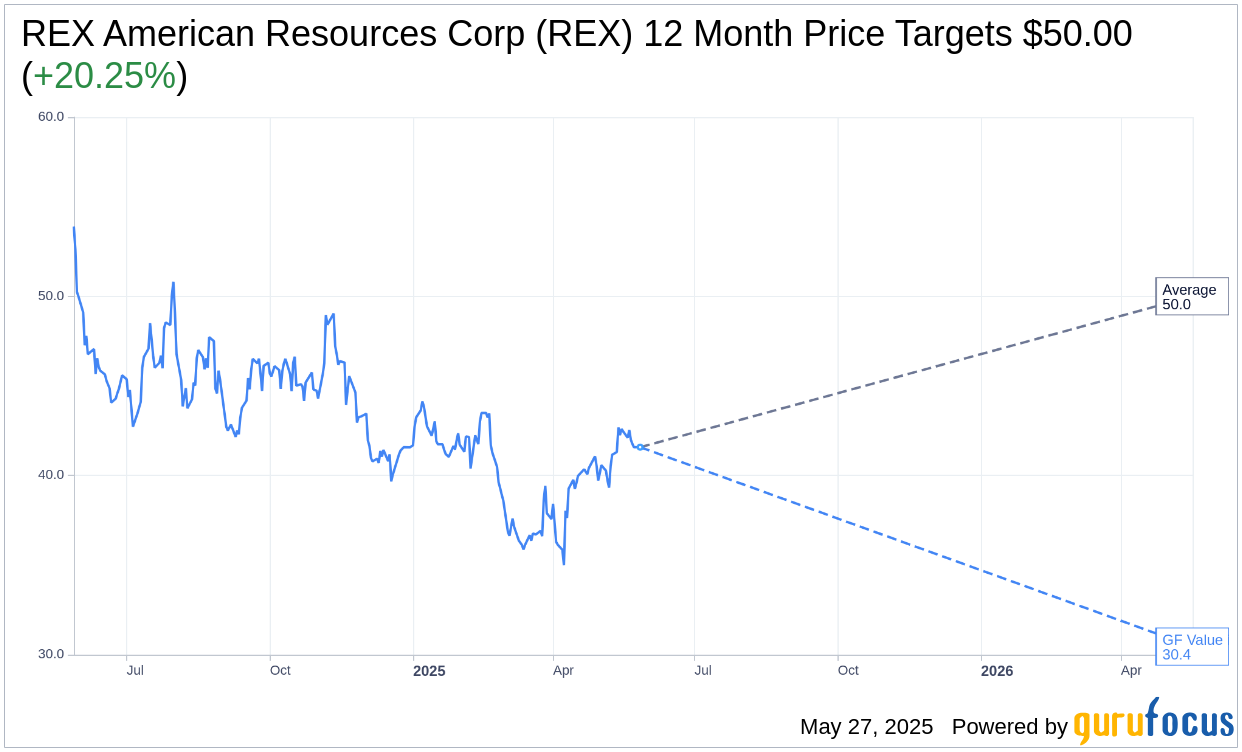
REX American Resources Corp (REX, Financial) 12 Month Price Targets
Based on the one-year price targets offered by 1 analyst, the average target price for REX American Resources Corp (REX) is $50.00, with a high estimate of $50.00 and a low estimate of $50.00. The average target implies an upside of 20.25% from the current price of $41.58.
Based on GuruFocus estimates, the estimated GF Value for REX American Resources Corp (REX, Financial) in one year is $30.45, suggesting a downside of -26.77% from the current price of $41.58.
Based on the consensus recommendation from 1 brokerage firm, REX American Resources Corp's (REX, Financial) average brokerage recommendation is currently 2.0, indicating an "Outperform" status. The rating scale ranges from 1 to 5, where 1 signifies Strong Buy, and 5 denotes Sell.
This article, generated by GuruFocus, is designed to provide general insights and is not tailored financial advice. Our commentary is rooted in historical data and analyst projections, utilizing an impartial methodology, and is not intended to serve as specific investment guidance. It does not formulate a recommendation to purchase or divest any stock and does not consider individual investment objectives or financial circumstances. Our objective is to deliver long-term, fundamental data-driven analysis. Be aware that our analysis might not incorporate the most recent, price-sensitive company announcements or qualitative information. GuruFocus holds no position in the stocks mentioned herein.